Business Intelligence 2.2.0: Introducing Business Studio with Powerful API and UI Enhancements
We’re excited to announce the public preview of Business Intelligence 2.2.0, a transformative release from Volkov Labs. This update empowers organizations to harness scalable, alert-driven analytics like never before. With the debut of Business Studio, alongside major API and UI upgrades, this release marks a significant step forward in delivering actionable business insights.
Here’s what’s new in version 2.2.0:
- Business Studio: A sleek control hub built with Electron and Tailwind UI, offering:
- Seamless management of Business Engines linked to Grafana.
- Easy configuration of alert rules and actions.
- Light/Dark theme support for a personalized experience.
- Installers for MacOS, Linux, and Windows (with auto-updates for MacOS/Windows).
- Full compatibility with Grafana 11 HTTP API.
- Simplified environment variables with sensible defaults.
- New Business Engine APIs for environment details and alert timelines.
Dive into the details below to see how these features can elevate your BI workflows.
Business Studio: Centralize Your BI Operations
Business Studio is your new command center for the Business Intelligence platform. Designed by Volkov Labs, this intuitive desktop application lets you connect and manage multiple Business Engines—each linked to a Grafana instance—while streamlining alert rules and actions.
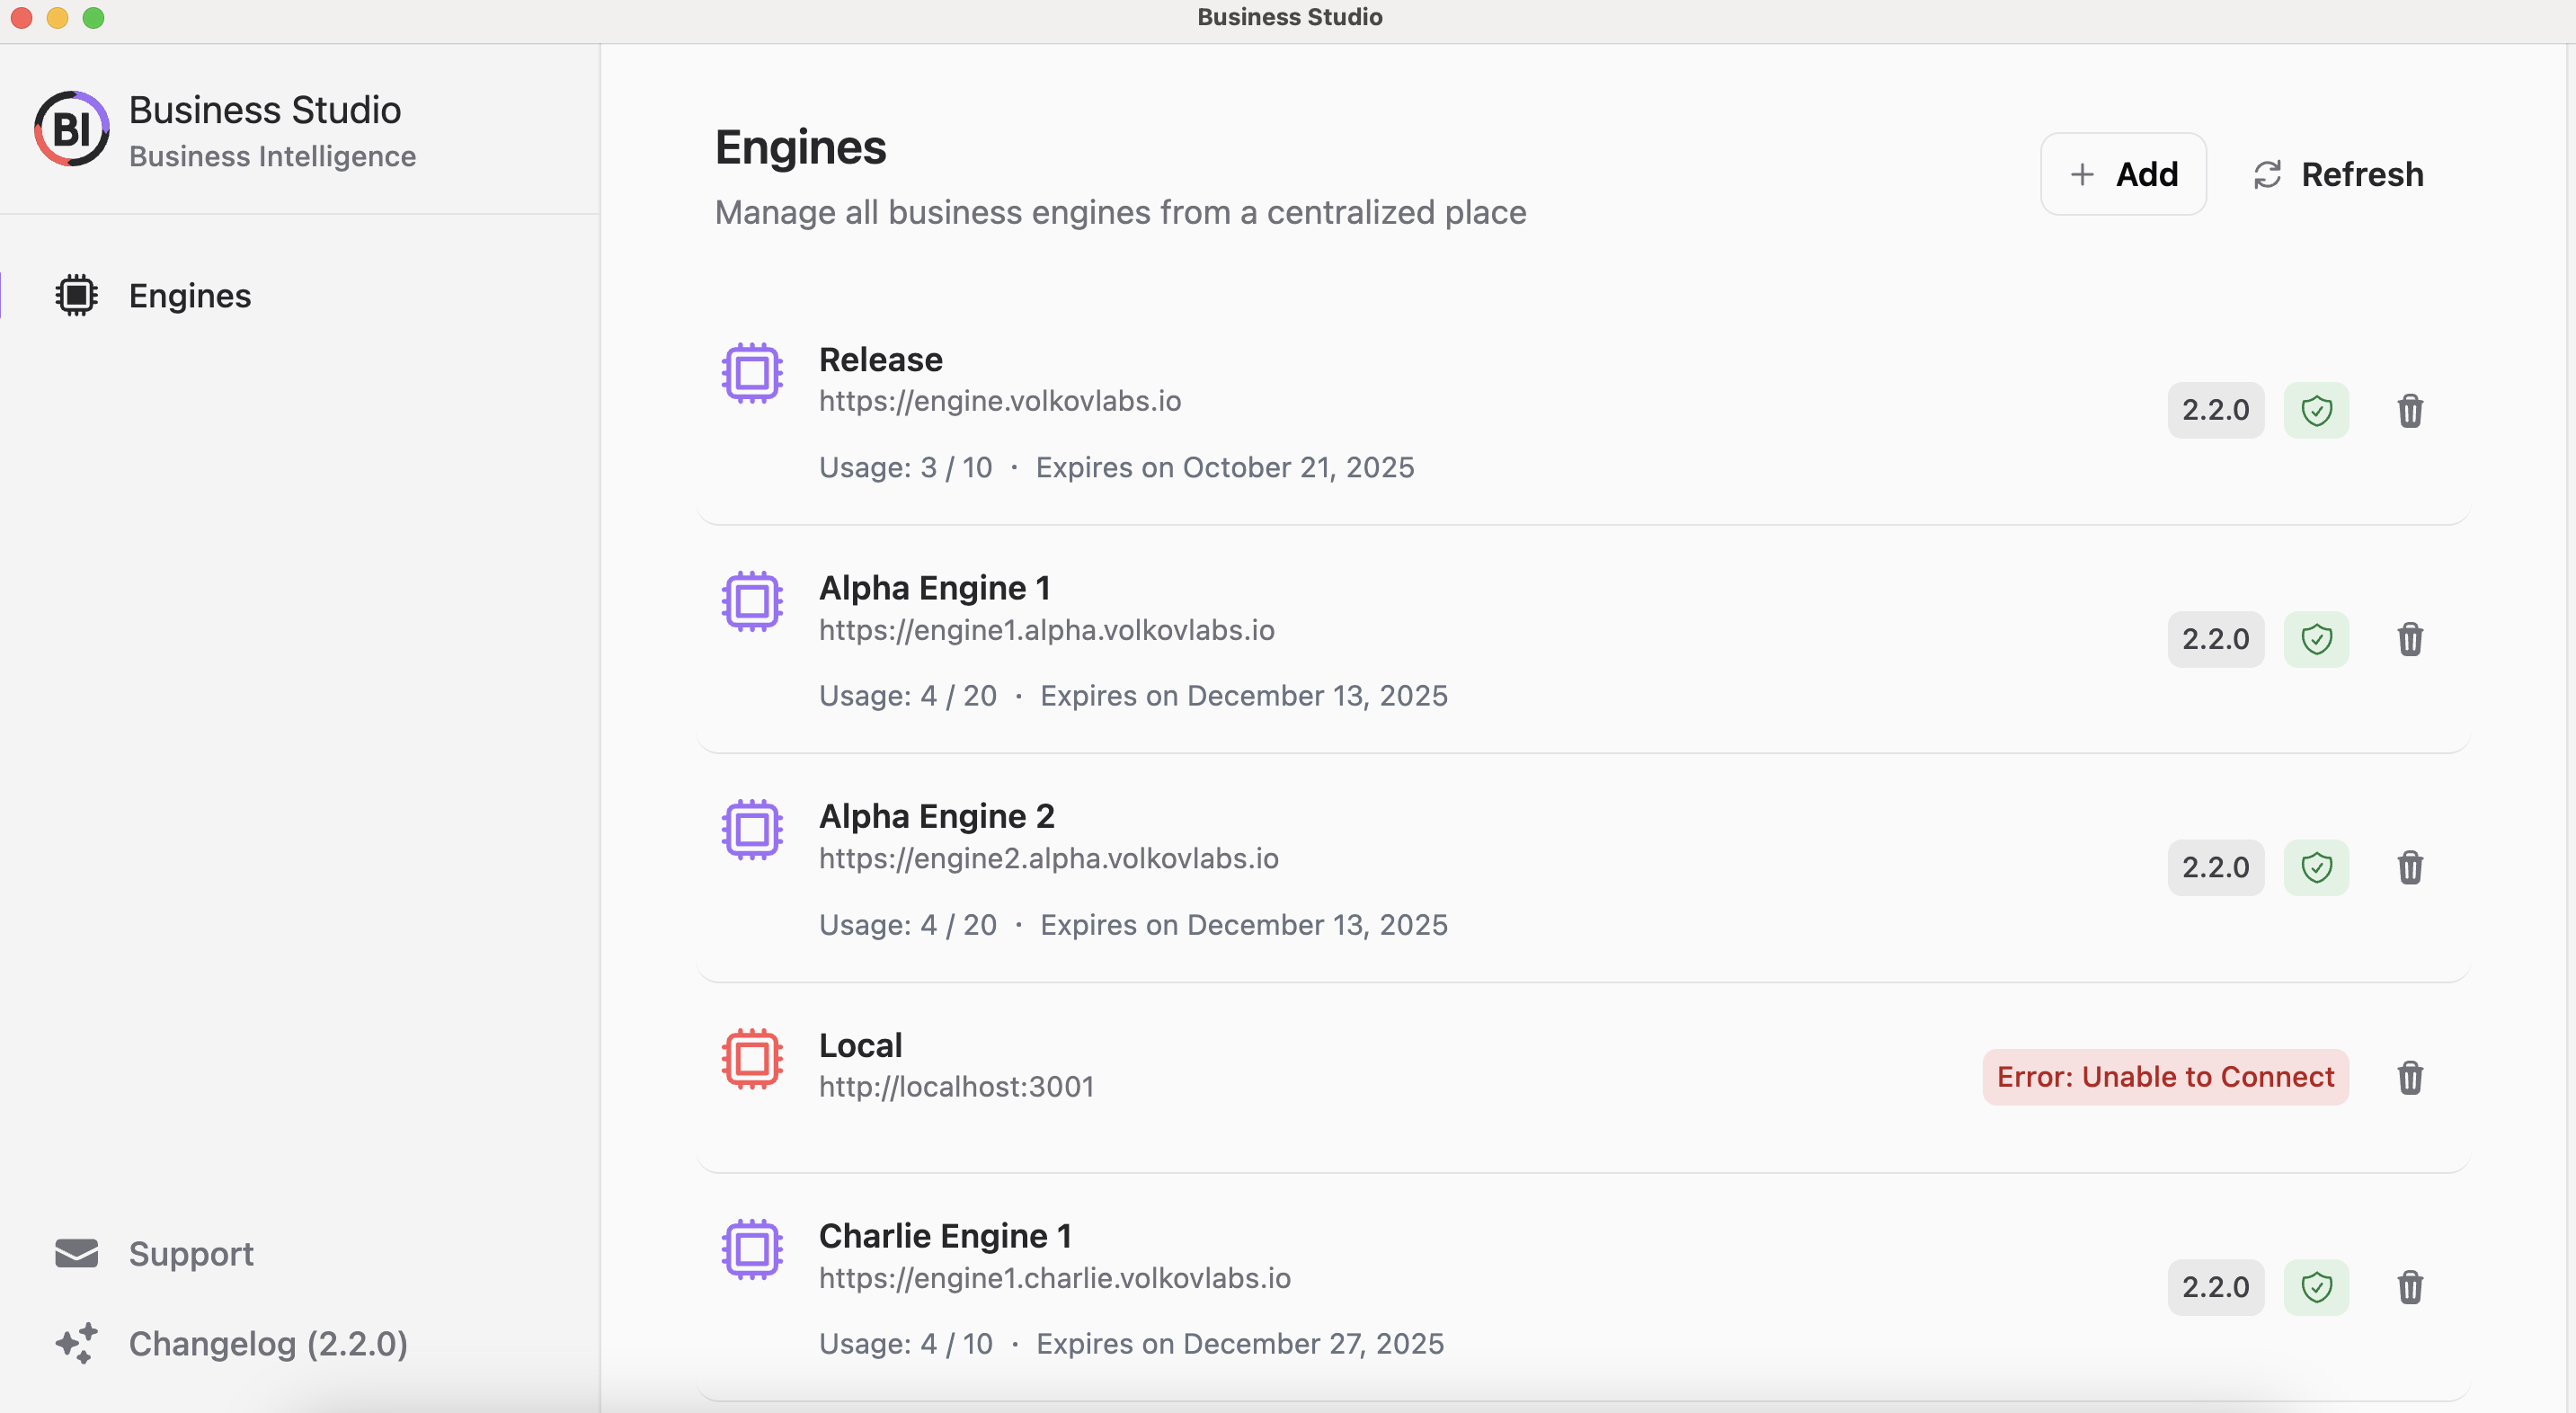
Detailed documentation is coming in early 2025. Follow our blog for the latest updates.
Ready to get started? Download Business Studio from the links below or check the Release Notes.
Effortlessly Add and Remove Business Engines
Adding a Business Engine is simple with the + Add button on the main screen:
- Enter a unique Engine Name for identification.
- Specify the Engine URL to connect to your Grafana instance.
- Provide a valid Token for authentication.
Need a token for more than 10 alerts? Reach out via the Support menu in Business Studio.
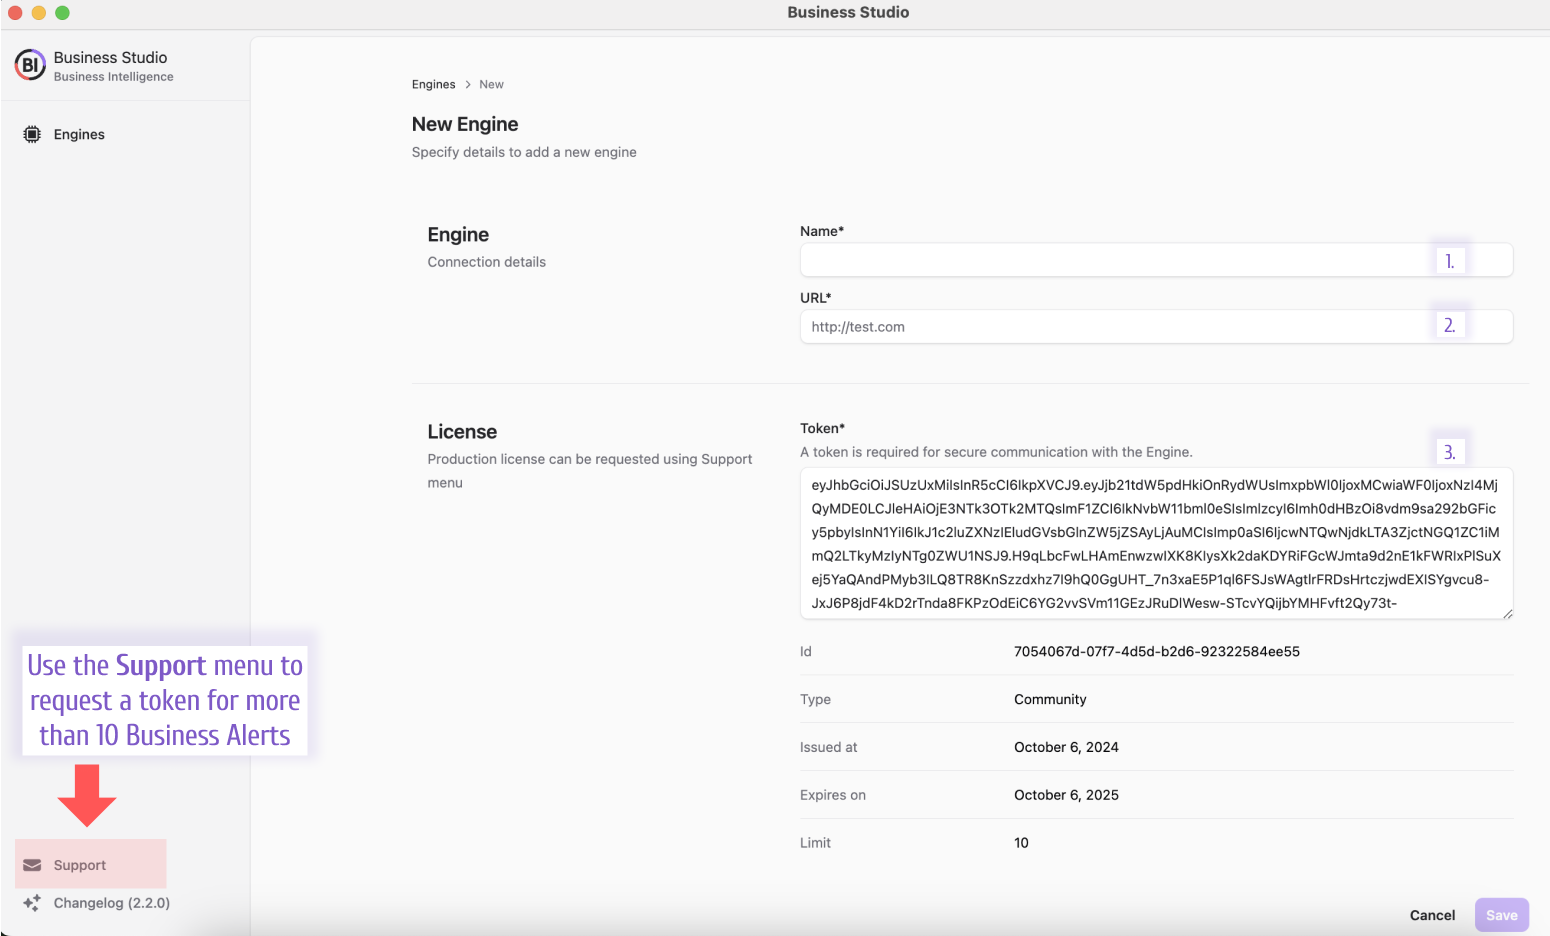
The Community version supports up to 10 alerts and one cluster. Unlock more with a subscription.
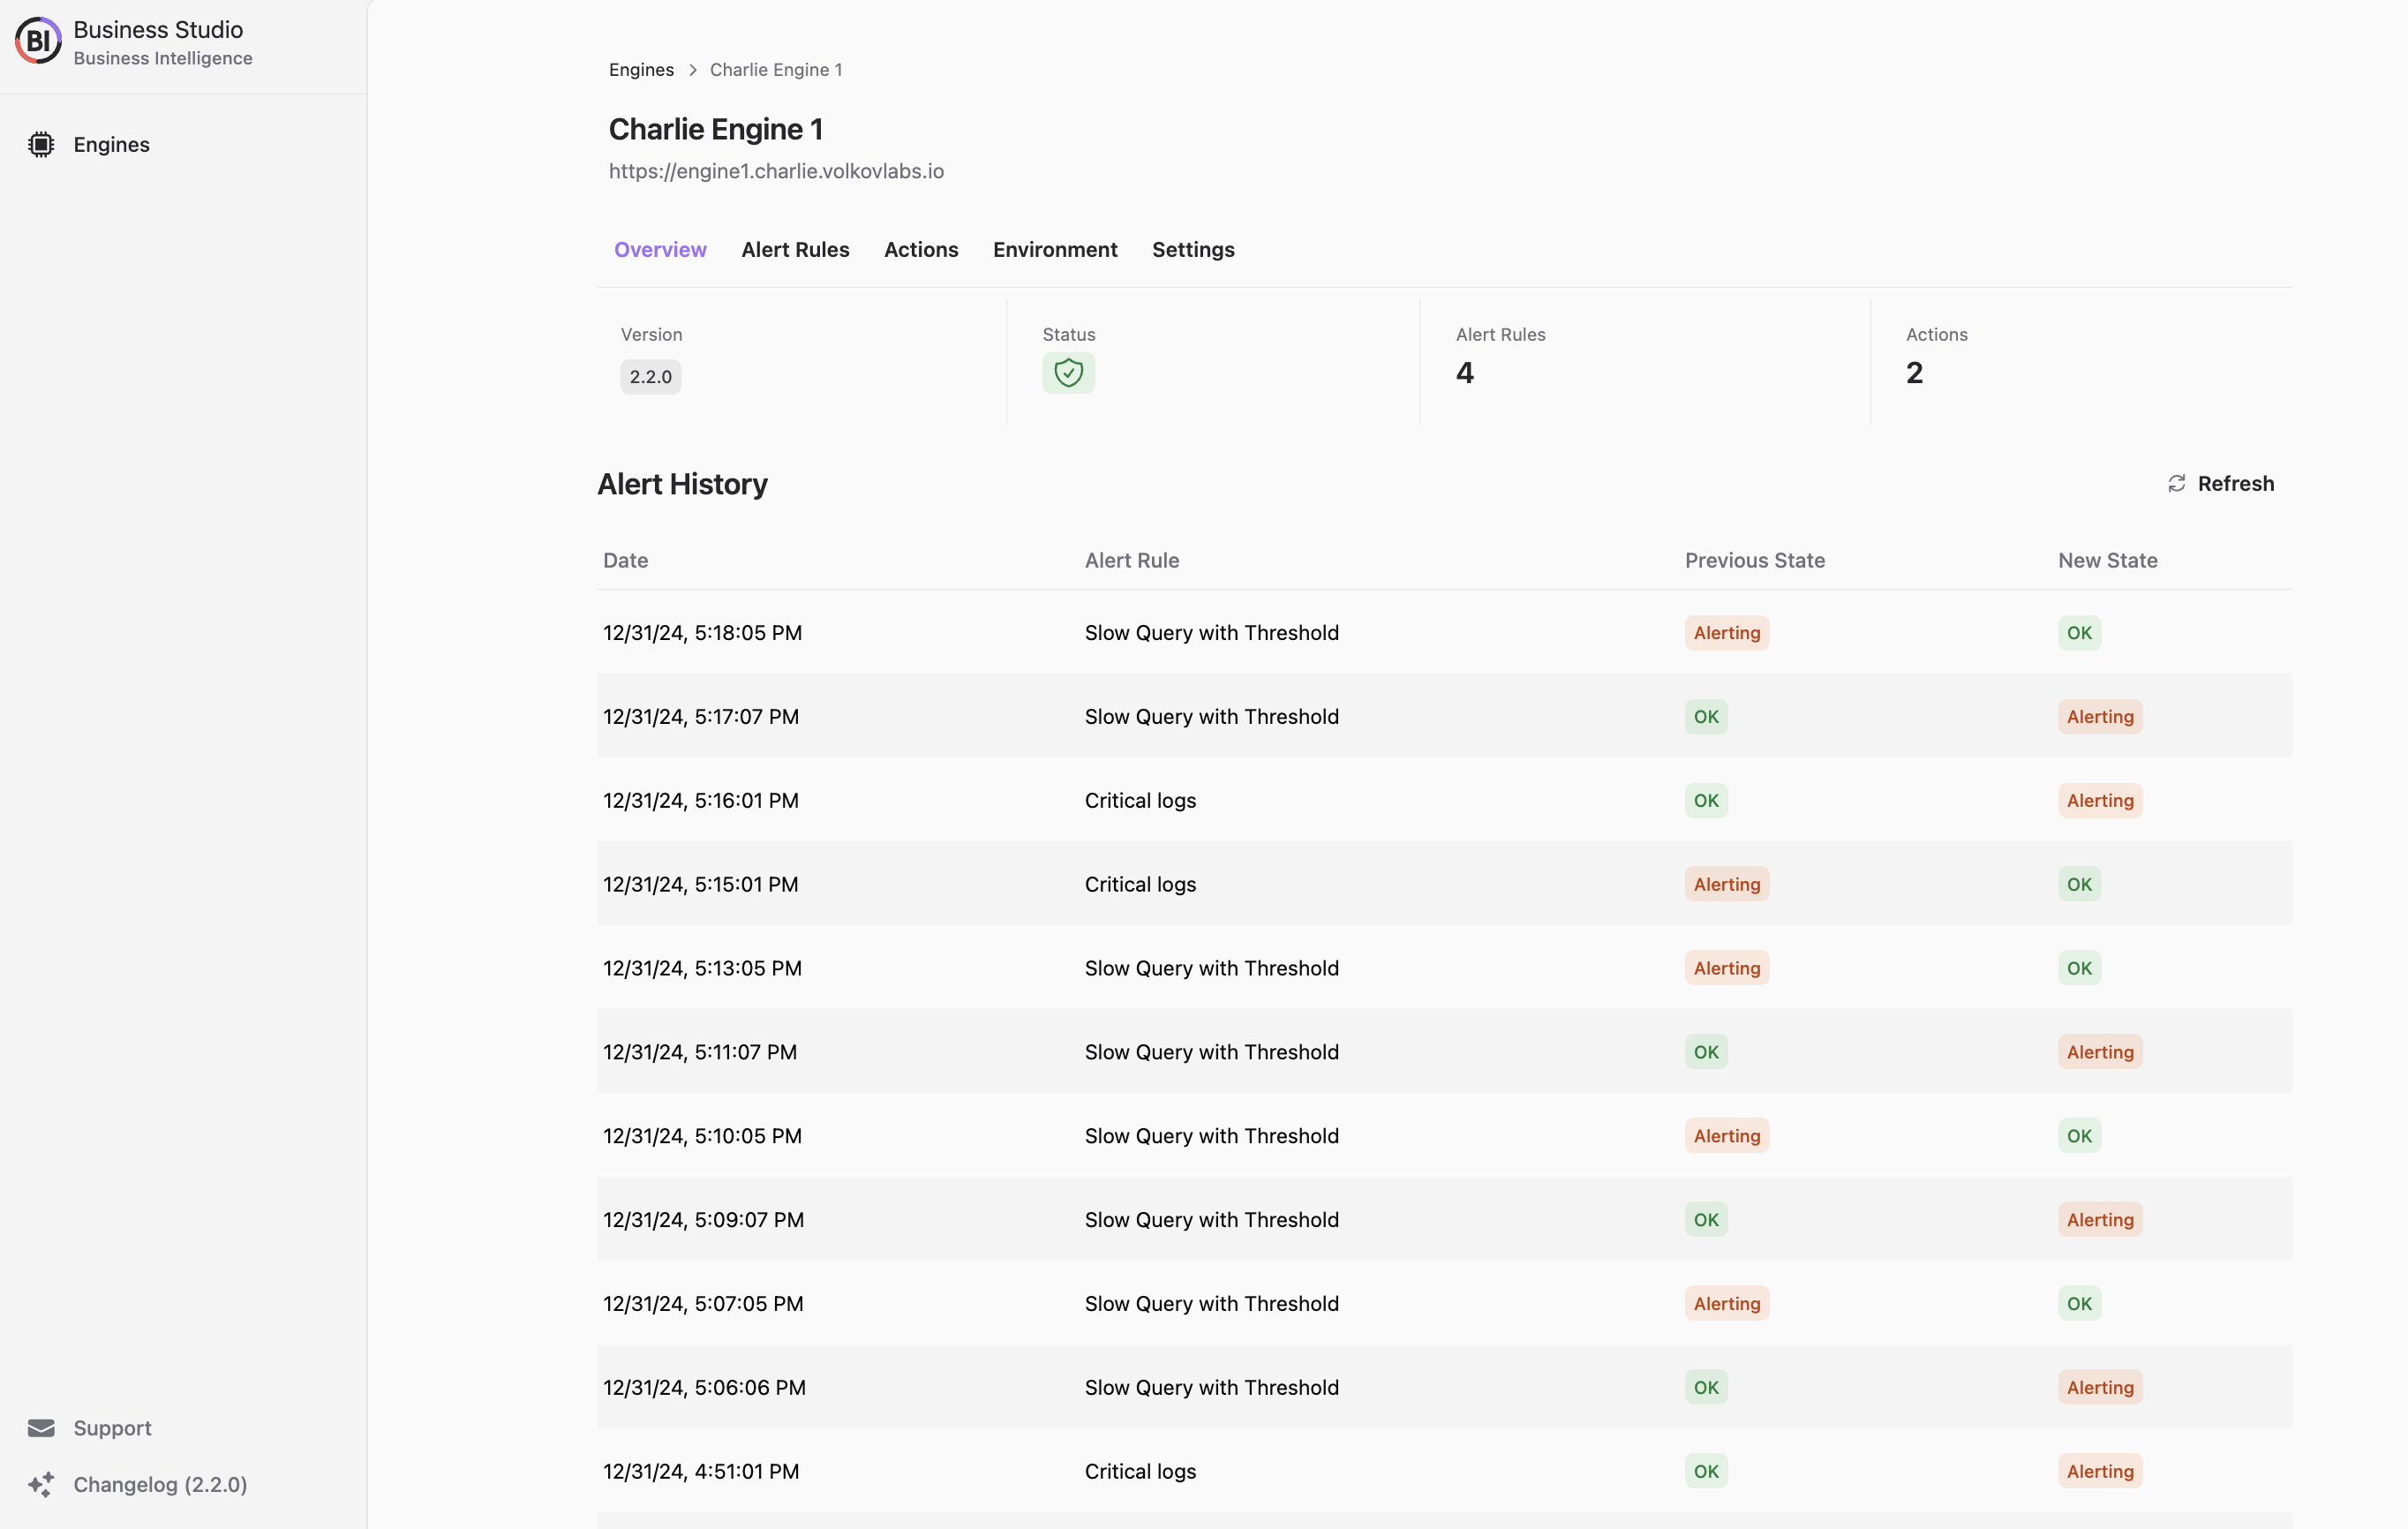
Once added, select an engine to explore its Overview, Alert Rules, Actions, Environment, and Settings tabs.
Streamline Alert Rule Management
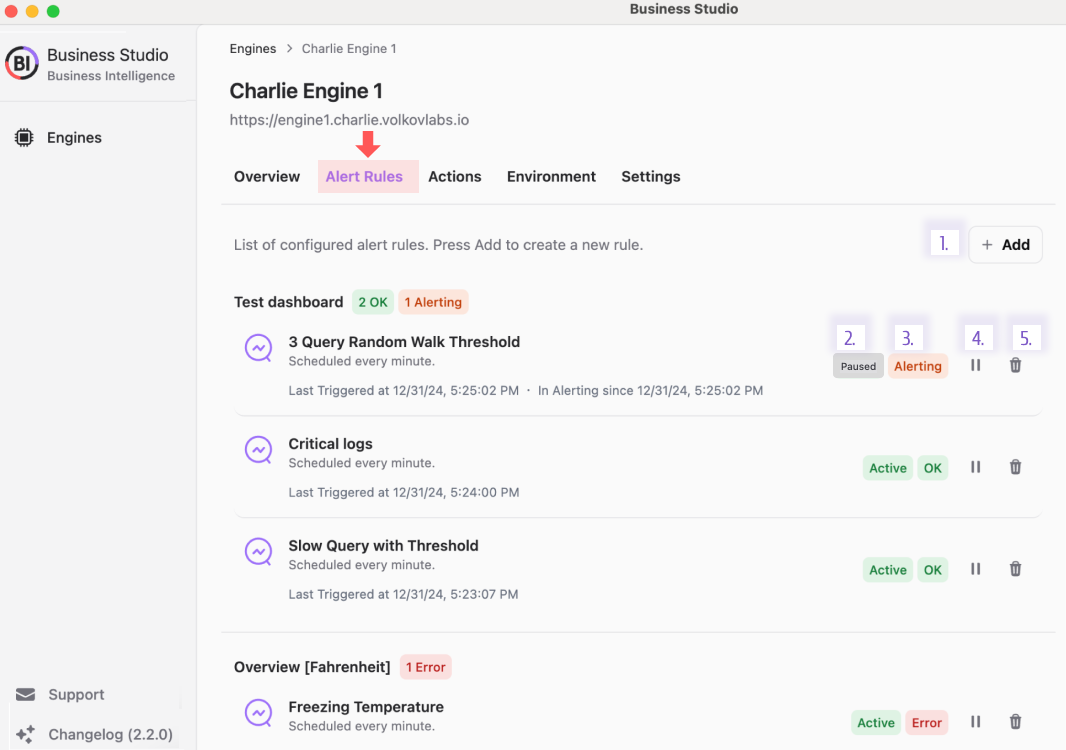
The Alert Rules tab offers powerful tools to:
- Create new rules with custom settings.
- Toggle rules between Active and Paused states.
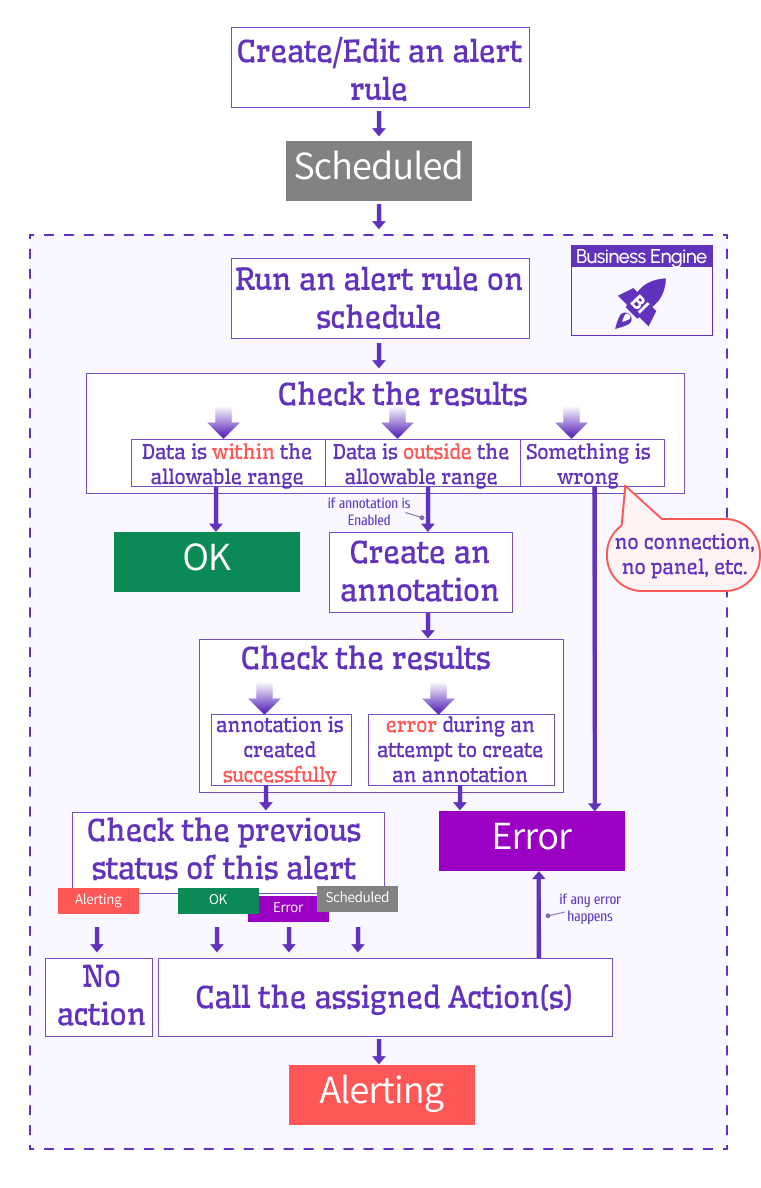
- Track rule statuses like Scheduled, OK, Alerting, or Error.
- Pause, start, or delete rules as needed.
Stay tuned for upcoming features like rule grouping and filtering to manage large sets of alerts effortlessly. For now, here’s how alert statuses flow:
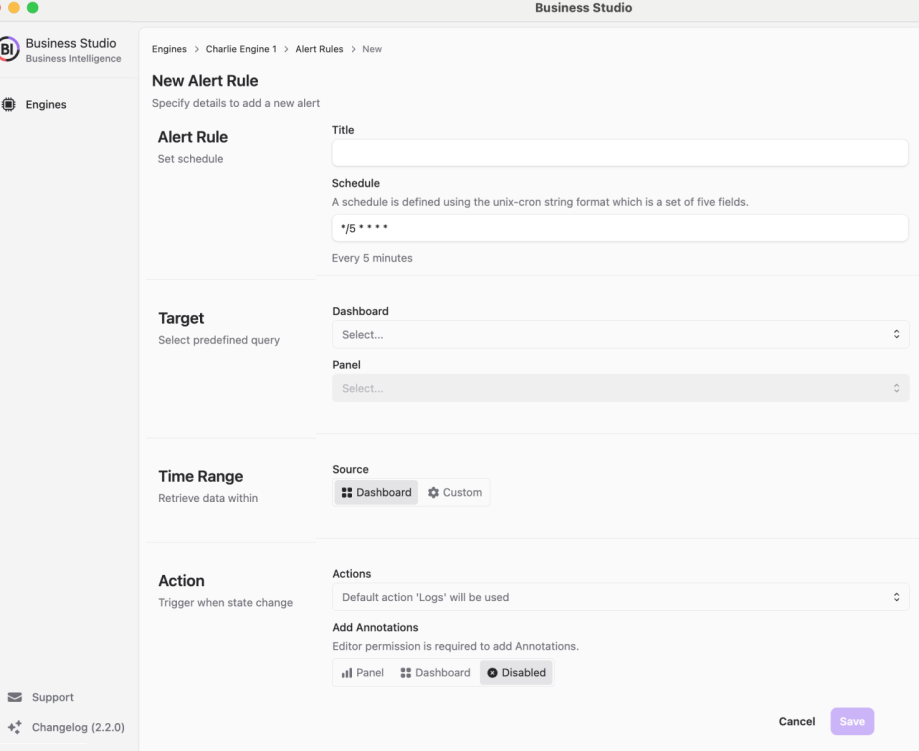
When adding a new rule, configure:
- Title: A descriptive name for the rule.
- Schedule: Frequency using CRON syntax (e.g., every minute or daily).
- Target Dashboard/Panel: Automatically fetch queries and thresholds.
- Time Range: Use dashboard defaults or set a custom range.
- Evaluation: Choose Thresholds (based on panel data) or Regex Pattern (search specific fields).
- Action: Link to a pre-configured API or action.
- Annotation: Attach to Panel, Dashboard, or disable it.
Configure Alert Actions with Precision
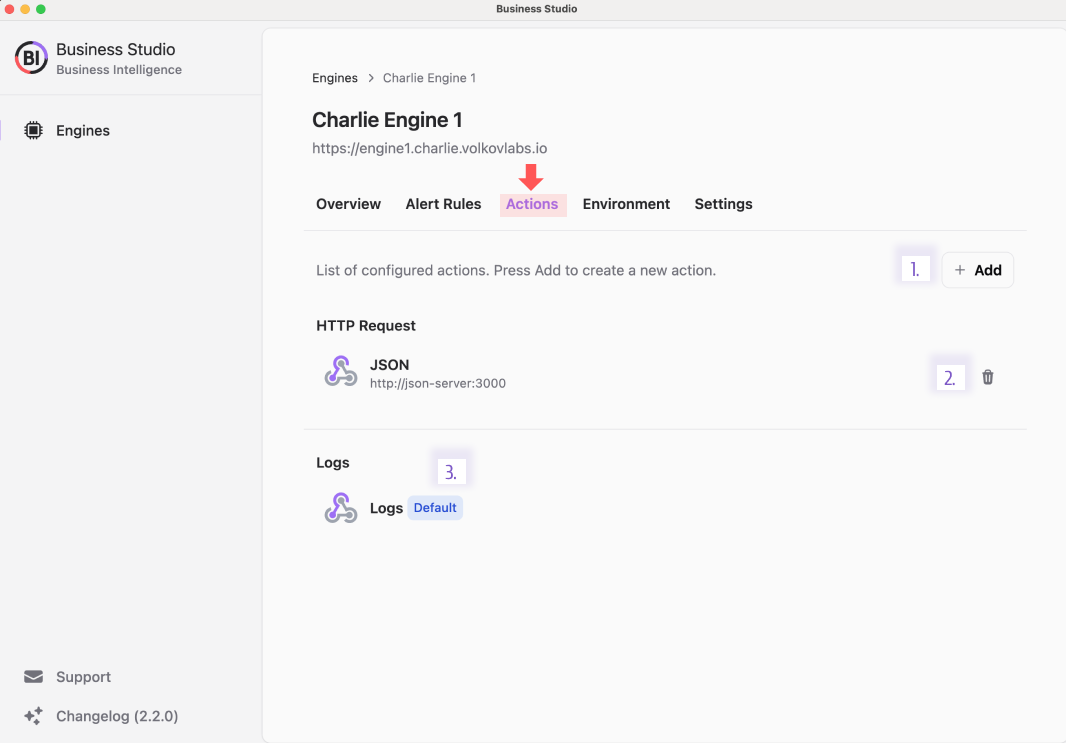
On the Actions tab, you can:
- Add custom actions for alerts.
- Remove actions (except the protected default action).
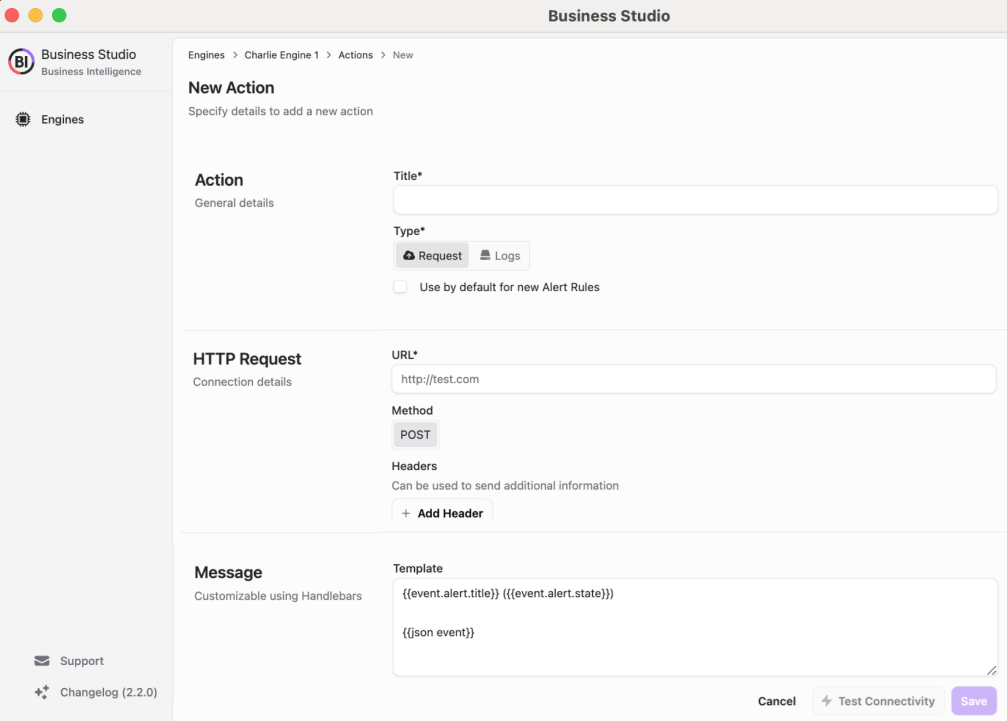
When creating a new action, specify:
- Title: Name of the action.
- Type: Choose between HTTP or Logs.
- HTTP Details: Define URL, method, and optional headers.
- Message: Customize with Handlebars templates.
- Test Connectivity: Validate the API endpoint before saving.
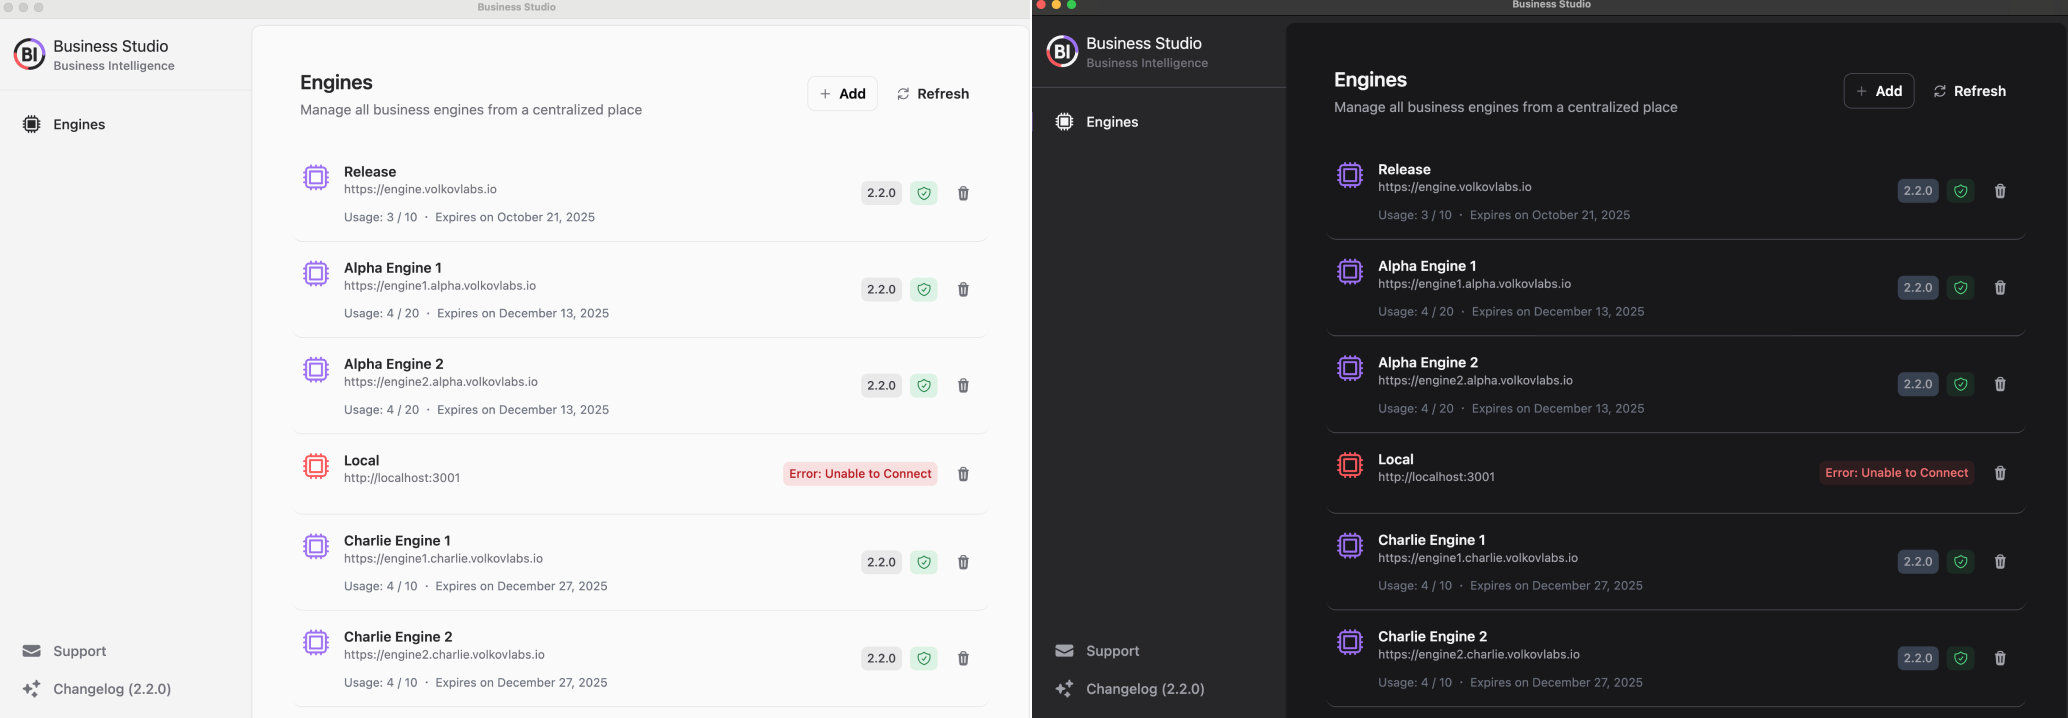
Adaptive Light and Dark Themes
Business Studio automatically adjusts to your system’s Light or Dark theme, ensuring a comfortable user experience.
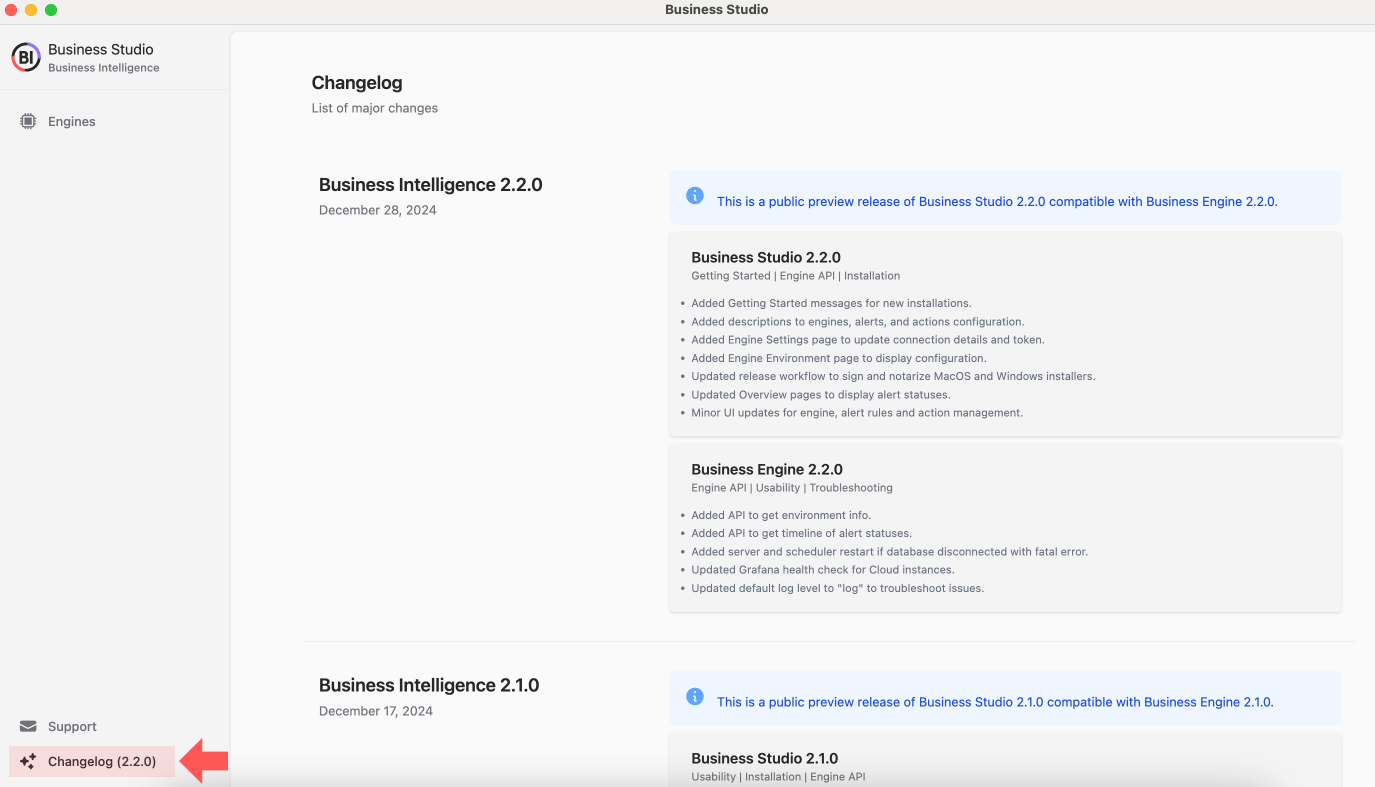
Hassle-Free Installation and Updates
Download one-click installers for MacOS, Linux, and Windows. Auto-updates are supported on MacOS and Windows, and you can view the latest changes via the Changelog in the app’s bottom-left corner.
Seamless Integration with Grafana 11 HTTP API
This release fully supports Grafana 11’s HTTP API. While compatibility with Grafana 10.x may work, it’s not officially tested—proceed with caution. Rest assured, we’ll continue to align with future Grafana updates for uninterrupted service.
Simplified Setup with Environment Variables
Configuring Business Intelligence is now easier with default values for most environment variables. Only these seven are mandatory:
- Timescale database connection details (for data storage).
- Grafana URL and Token (via Service Account for API access).
loading...
Powerful New Engine APIs
Access Environment Information
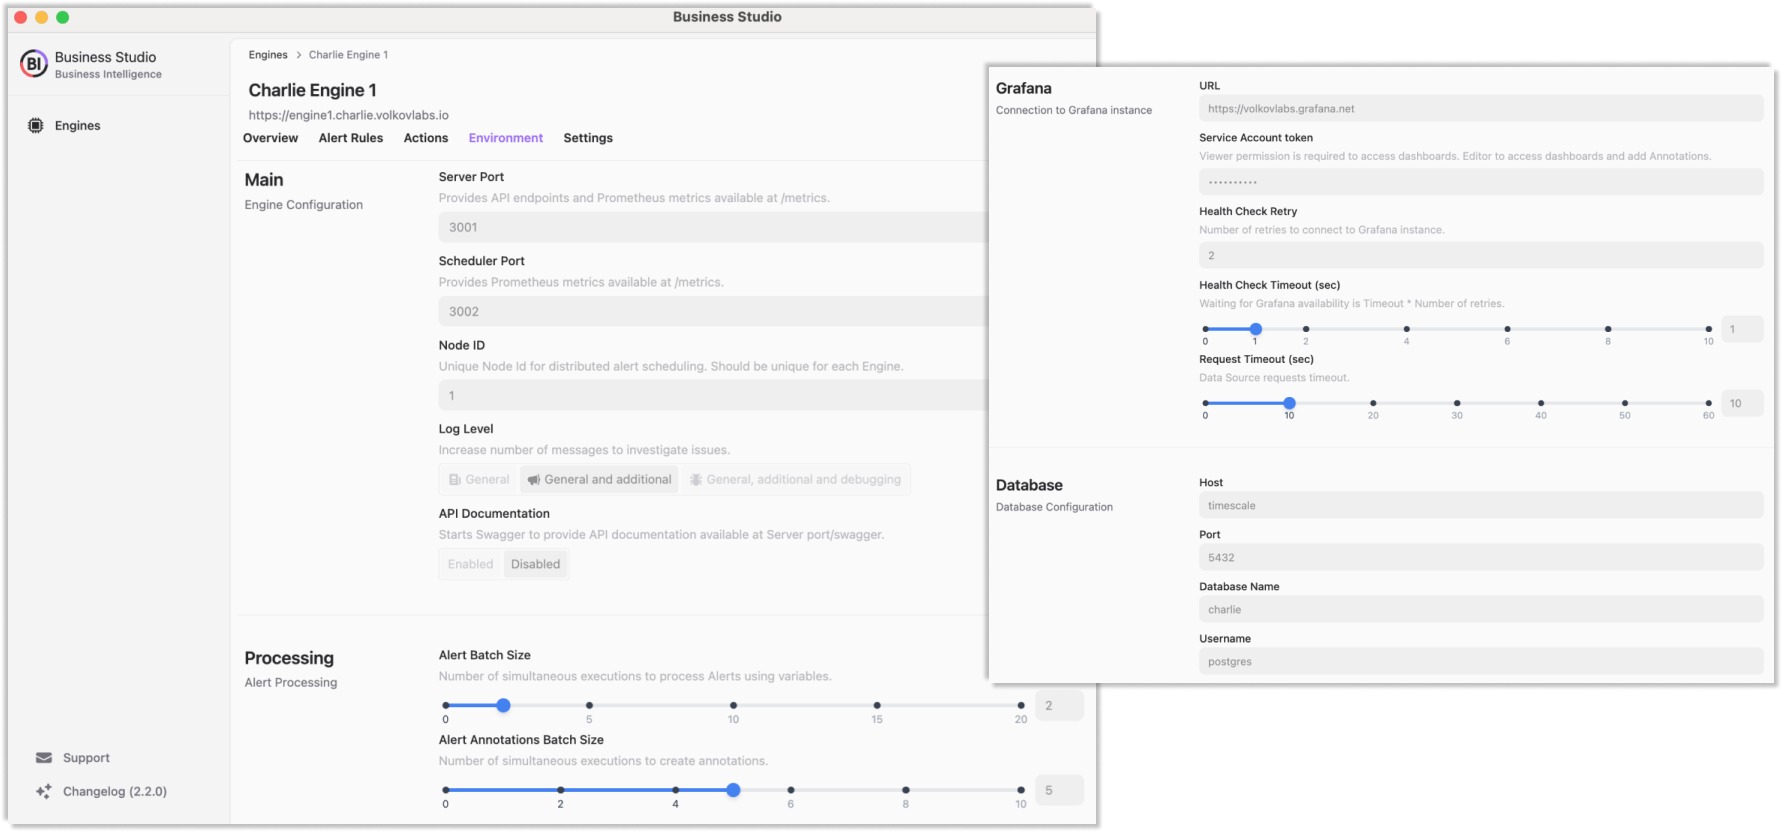
Check all environment variables directly from the Environment tab using the GET /environment endpoint. Editing capabilities are planned for a future update.
Track Alert Status Timelines
The GET timeline endpoint provides a streamlined history of alert state changes, filtering out duplicate entries for clarity.
Full Alert History Example:
date                      Previous            New
1/1/25, 10:29:01 AM       OK                  Alerting
1/1/25, 10:28:01 AM       OK                  OK
1/1/25, 10:27:01 AM       OK                  OK
1/1/25, 10:26:01 AM       OK                  OK
1/1/25, 10:25:01 AM       OK                  OK
1/1/25, 10:24:01 AM       OK                  OK
Filtered Timeline Output:
date                      Previous            New
1/1/25, 10:29:01 AM       OK                  Alerting
Downloads: Business Studio 2.2.0
All MacOS and Windows installers are signed, notarized, and built using automated GitHub workflows for maximum security.
- MacOS:
- Linux:
- Windows:
Getting Started
Business Intelligence Platform is a powerful solution that harnesses Docker containers to deliver a modular, scalable, and user-friendly environment for alert-driven analytics. Whether you're just starting out or are an experienced user, our Quick Start Guide is designed to help you set up and deploy the platform effortlessly.
This guide provides a step-by-step walkthrough of the essential setup process, ensuring you can get up and running in no time. Key topics include:
- Configuring the Business Engine: Understand how to set up the core component that powers your analytics.
- Launching the Business Studio: Deploy and access the intuitive interface on your local machine for seamless management and visualization.
We’d Love to Hear From You!
Your feedback and ideas are invaluable to us! Here’s how you can get involved:
- Questions, Feature Requests, or Bugs: Submit a Zendesk ticket to receive a swift and personalized response from our dedicated support team.
- Join the Community: Subscribe to our YouTube Channel and share your thoughts or suggestions in the comments.
Your input is crucial in helping us grow and improve, so please don’t hesitate to reach out!


