Business Intelligence 2.4.0: Streamlined Grafana Integration, Alert Insights, and More
We’re excited to announce the public preview of Business Intelligence 2.4.0 from Volkov Labs. This release enhances the Business Intelligence platform with powerful new features designed to simplify workflows and boost efficiency:
- Effortless Grafana connection through Business Studio.
- Detailed alert event insights for faster troubleshooting.
- High Availability (HA) status visibility in Business Engine.
- Simplified alert scheduling with intuitive templates.
- Data frame previews directly in Business Studio.
- Improved user prompts for seamless configuration.
- Updated Business Engine API for better integrations.
Read on to explore how these updates can transform your BI experience.
Connect Grafana Effortlessly with Business Studio
Say goodbye to manual configuration of GRAFANA_TOKEN in config files. Business Studio now provides a intuitive interface to connect a Business Engine to your Grafana instance in just a few clicks:
- Navigate to the Business Engine > Environment page.
- In the Grafana section, click Edit.
- Input your Grafana URL and Service Account token.
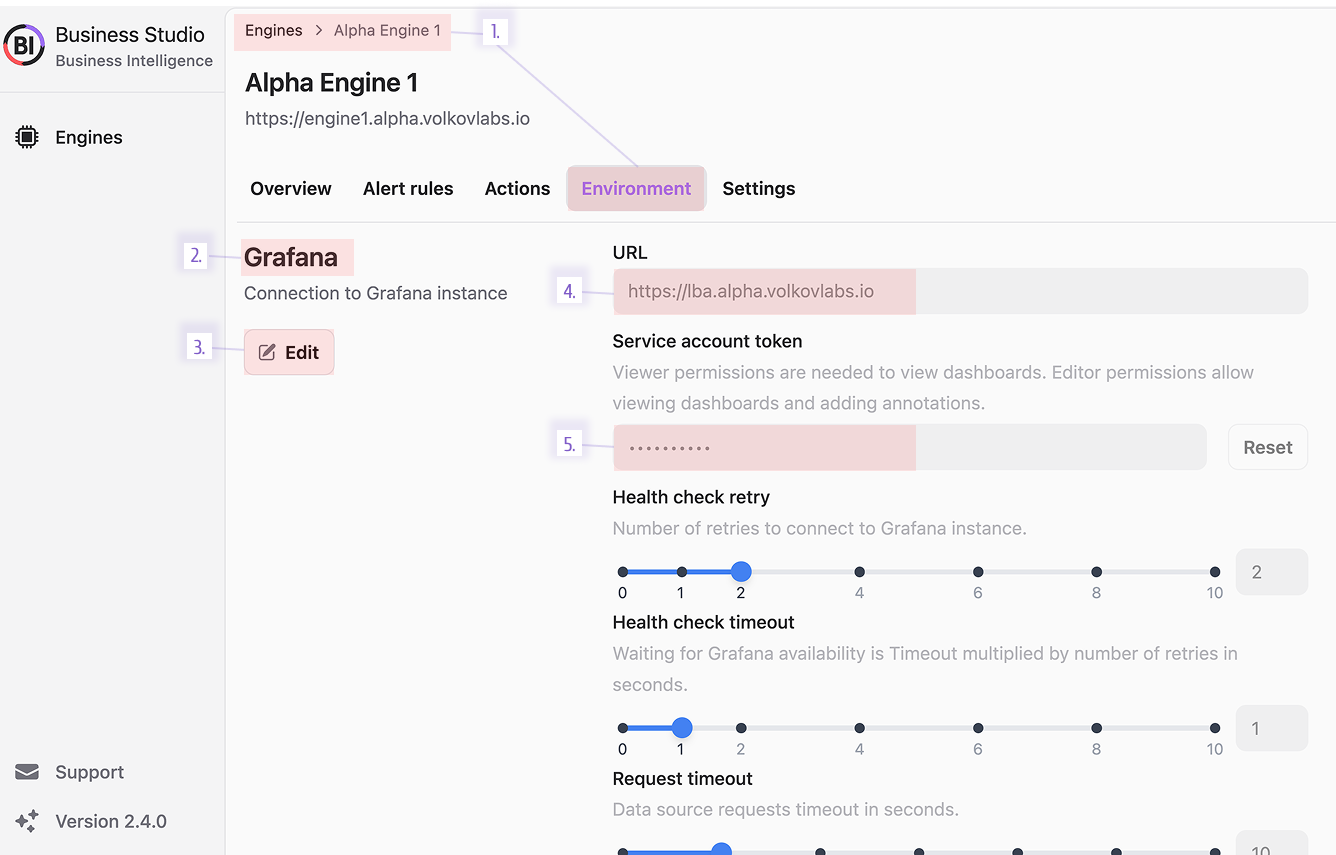
This updates the grafana_token in the environments table. For High Availability (HA) setups, updating one engine automatically syncs all others in the same database cluster—no need for repetitive adjustments.
Update a single Business Engine, and the rest of your cluster aligns instantly.
Gain Deeper Insights into Alert Events
An “alert event” refers to a database record of an alert, also known as an alert record.
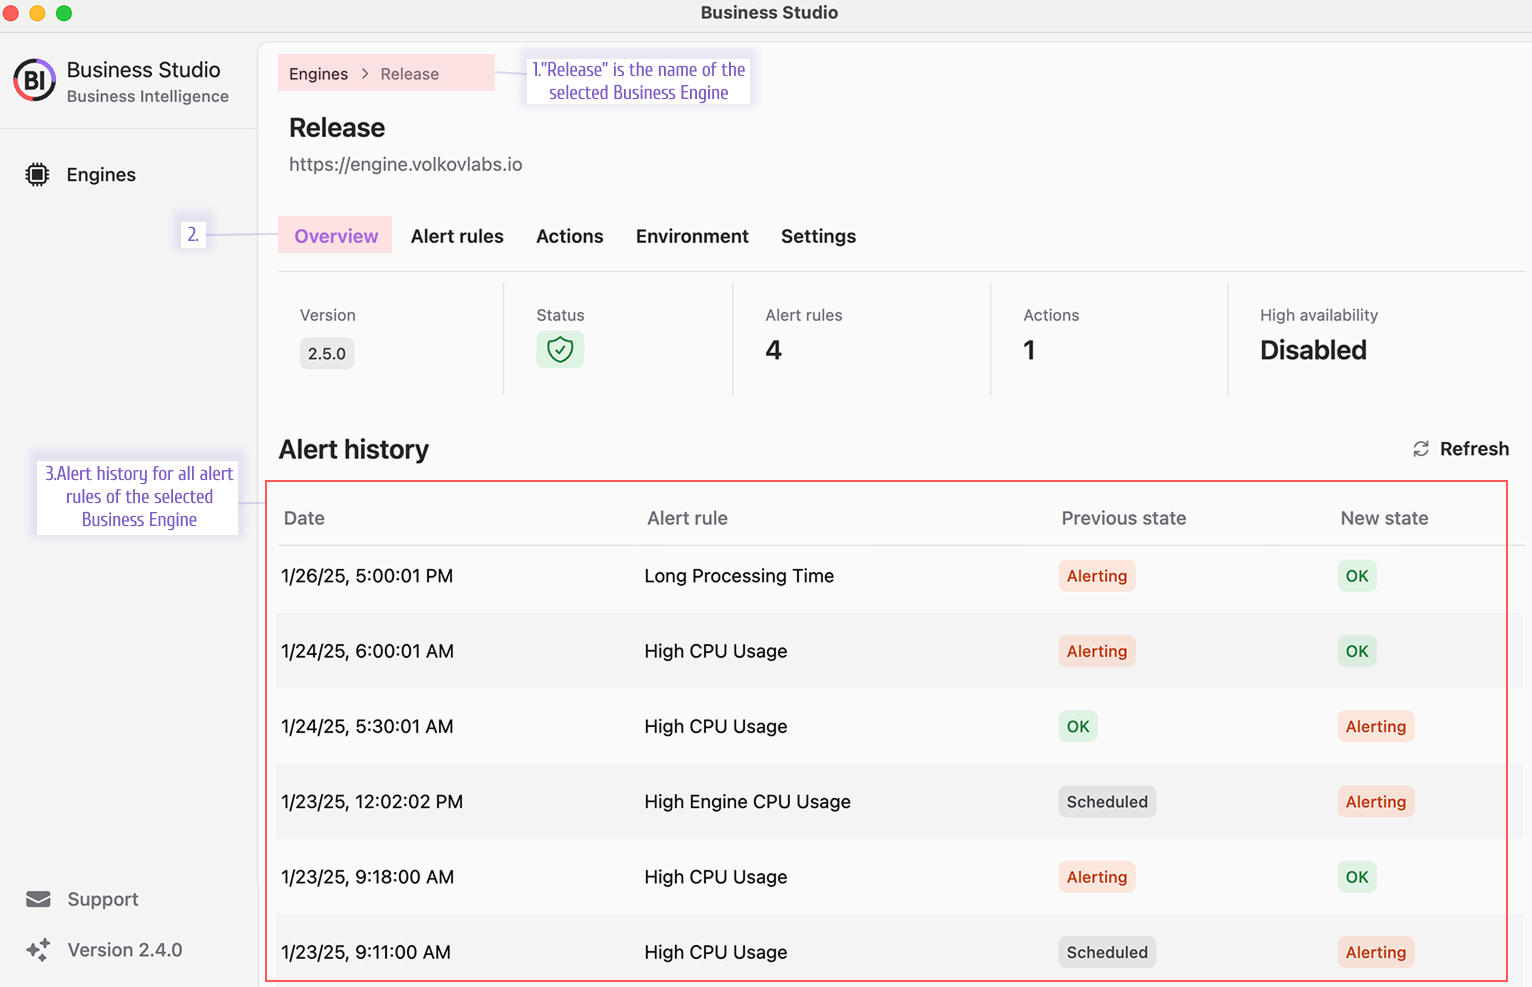
View All Alert Rules at Once
- Head to a Business Engine’s Overview page.
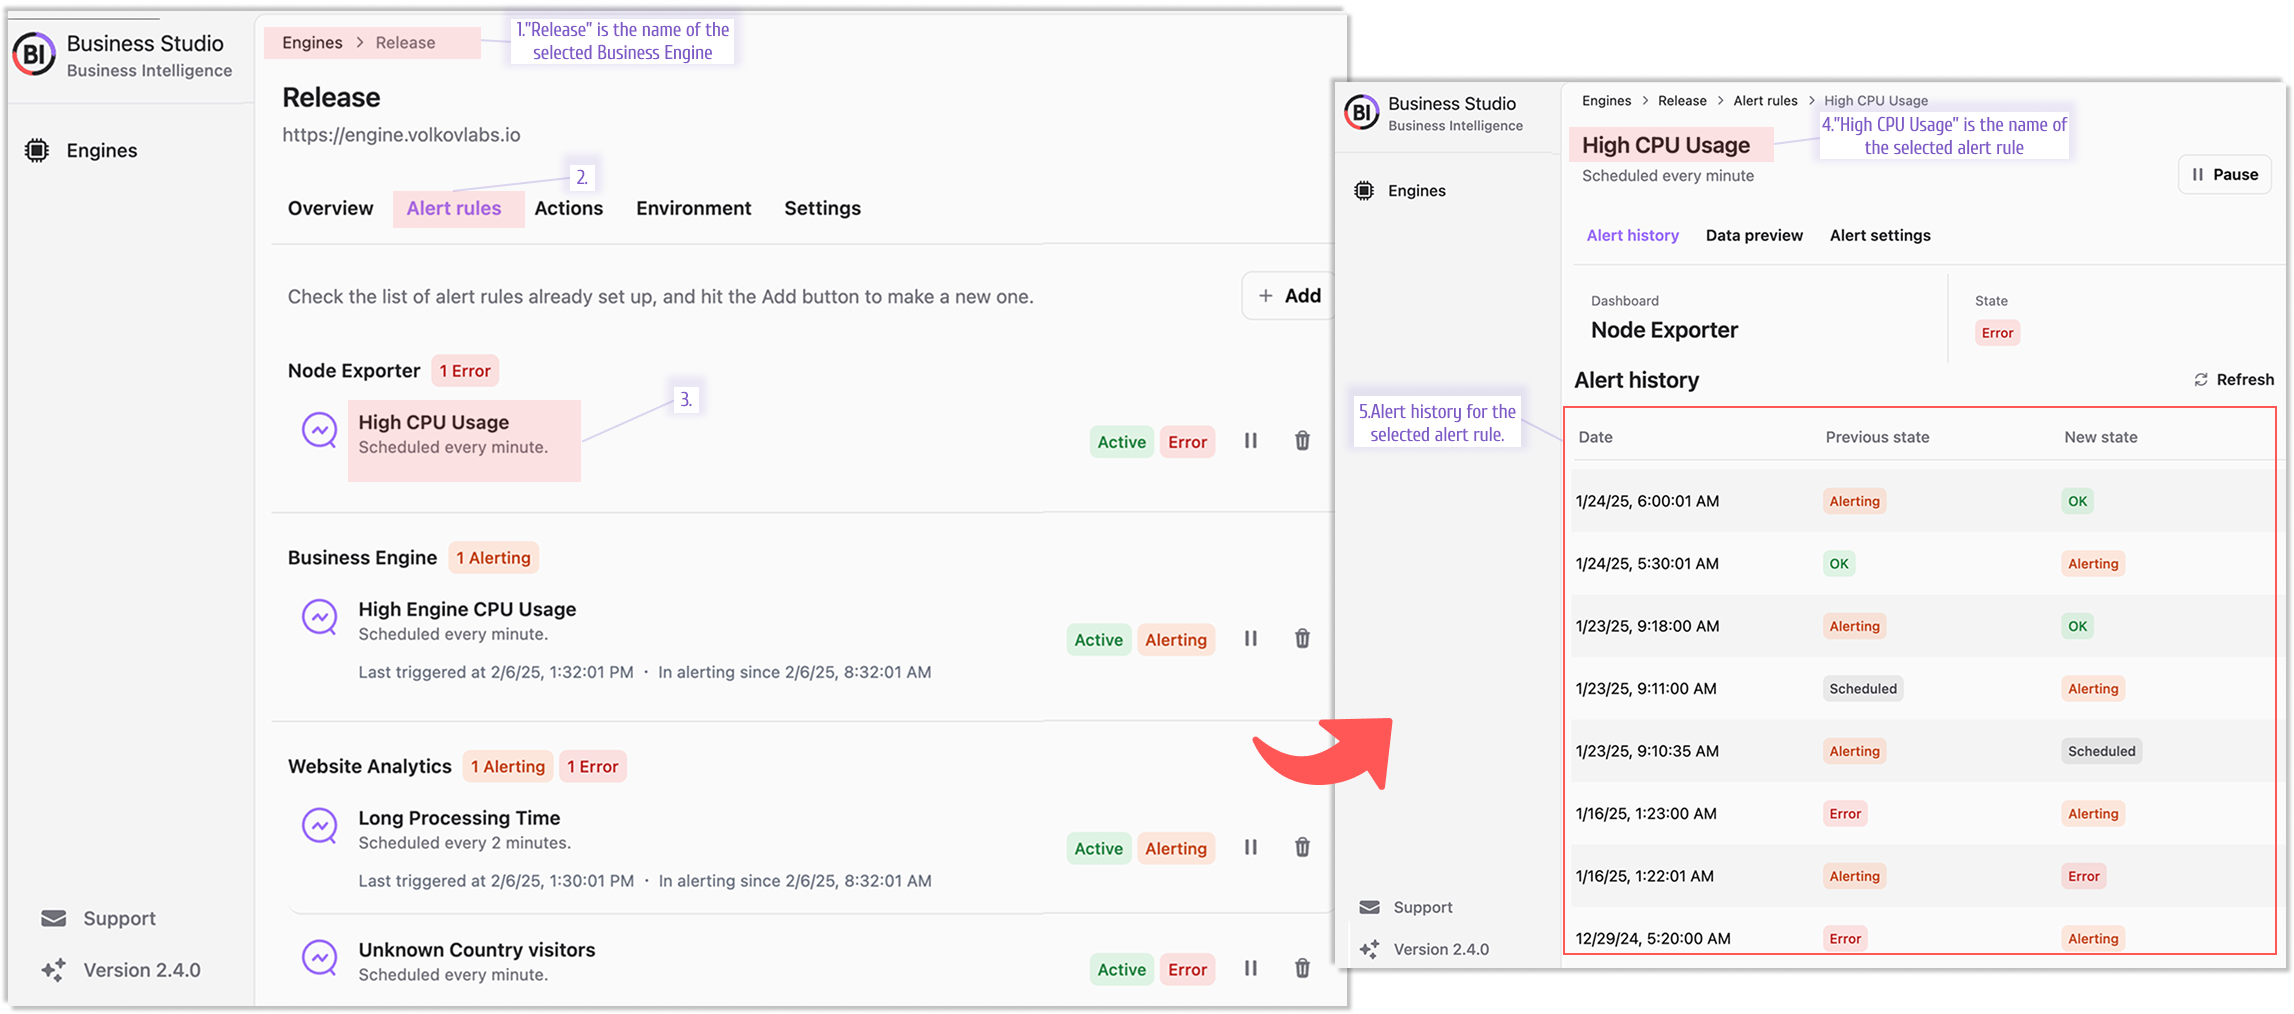
- Access the Alert History section for a comprehensive view of all alert events.
Drill Down into a Single Alert Rule
- From the Alert Rules page, select a specific rule and explore its Alert History.
- Click any event for detailed insights:
- Alerting State: See triggering values in the Alert Evaluations section. Use View as Code for the complete payload.
- Other States: Review payloads directly within Alert Evaluations.
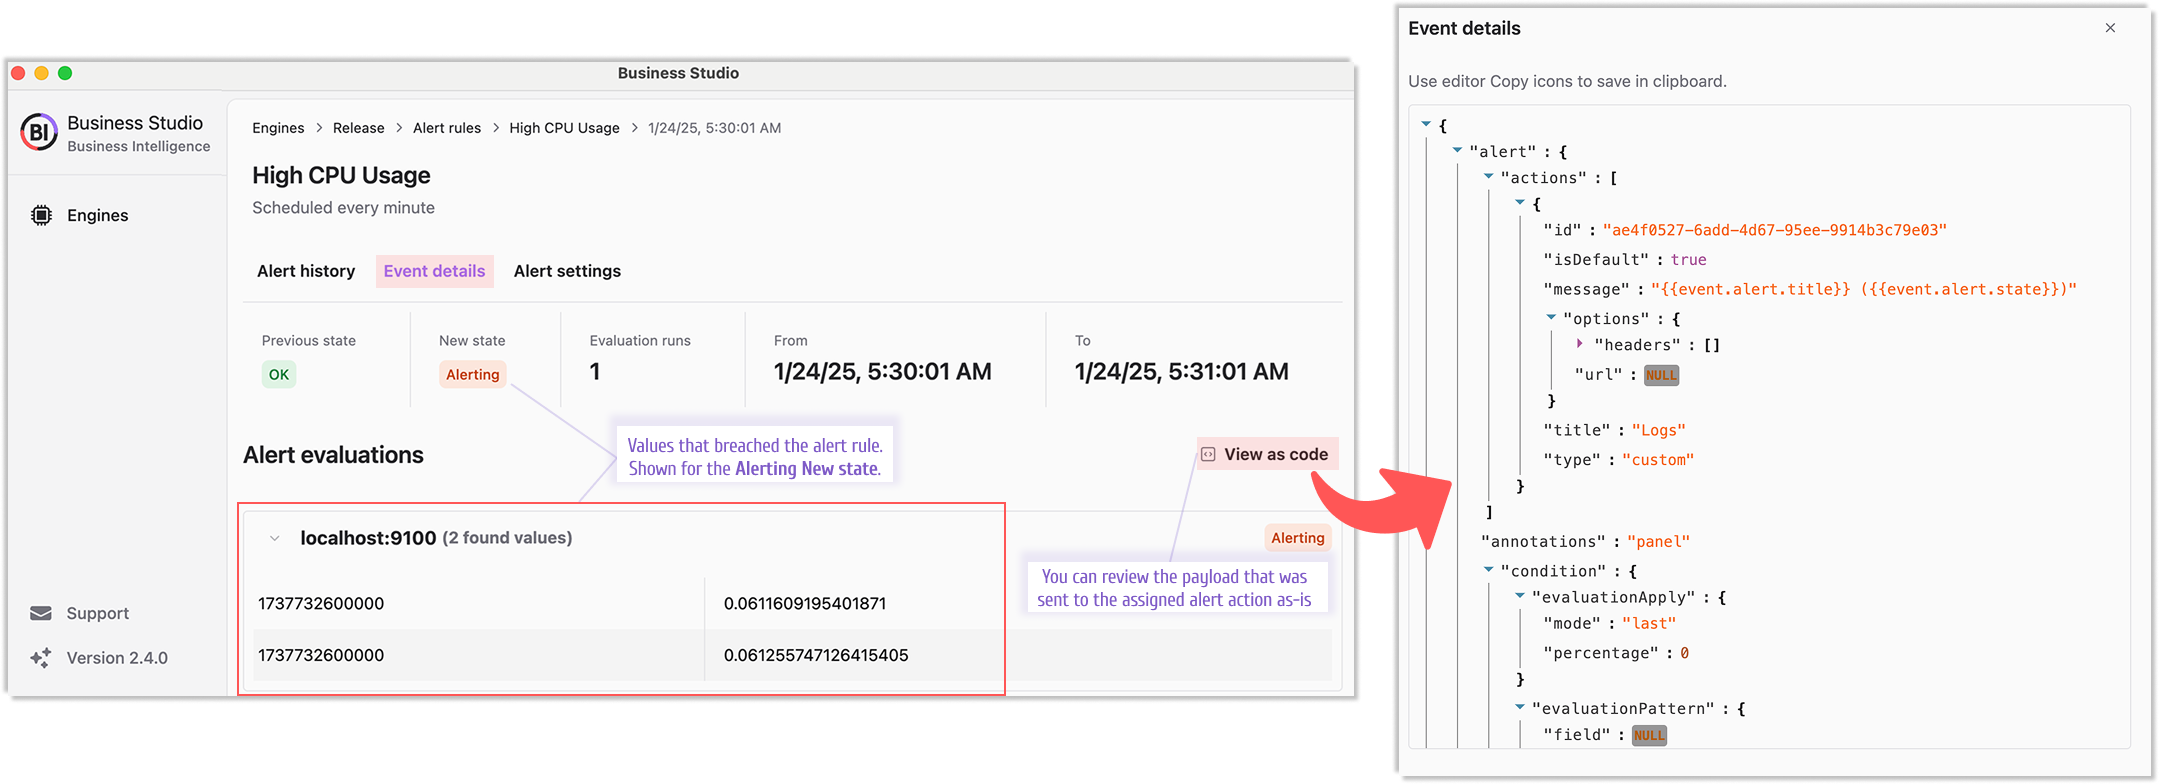
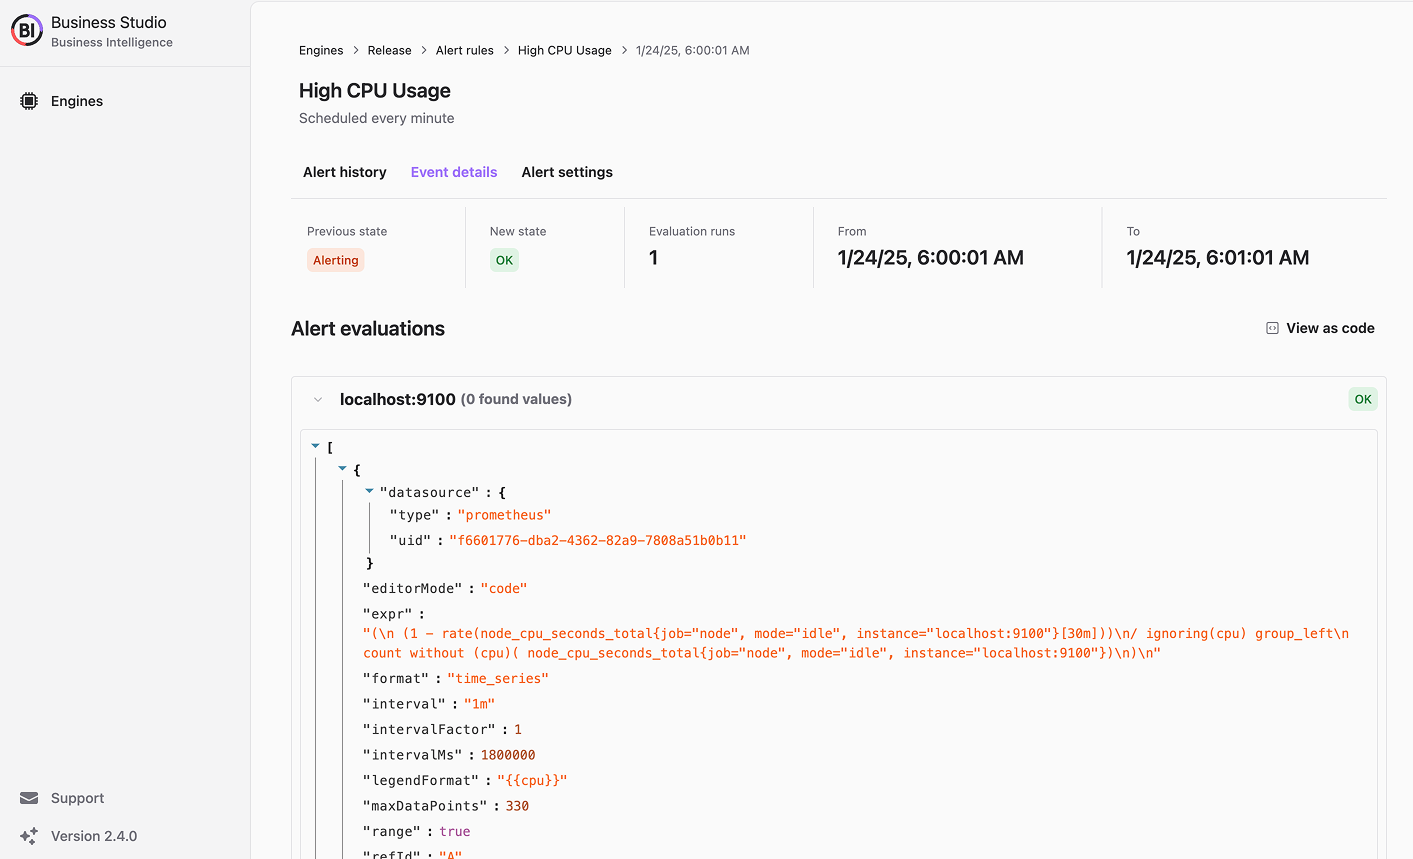
These improvements make troubleshooting alerts faster and more accurate.
Monitor High Availability (HA) Status
The Business Engine Overview page now displays HA status clearly:
- Disabled: Indicates a single engine in the cluster.
- Enabled: Confirms multiple engines are active.

Simplify Alert Scheduling
Setting up alert rules is now more accessible with preset scheduling templates alongside traditional Cron expressions. Choose a template and customize it as needed—no deep Cron knowledge required.
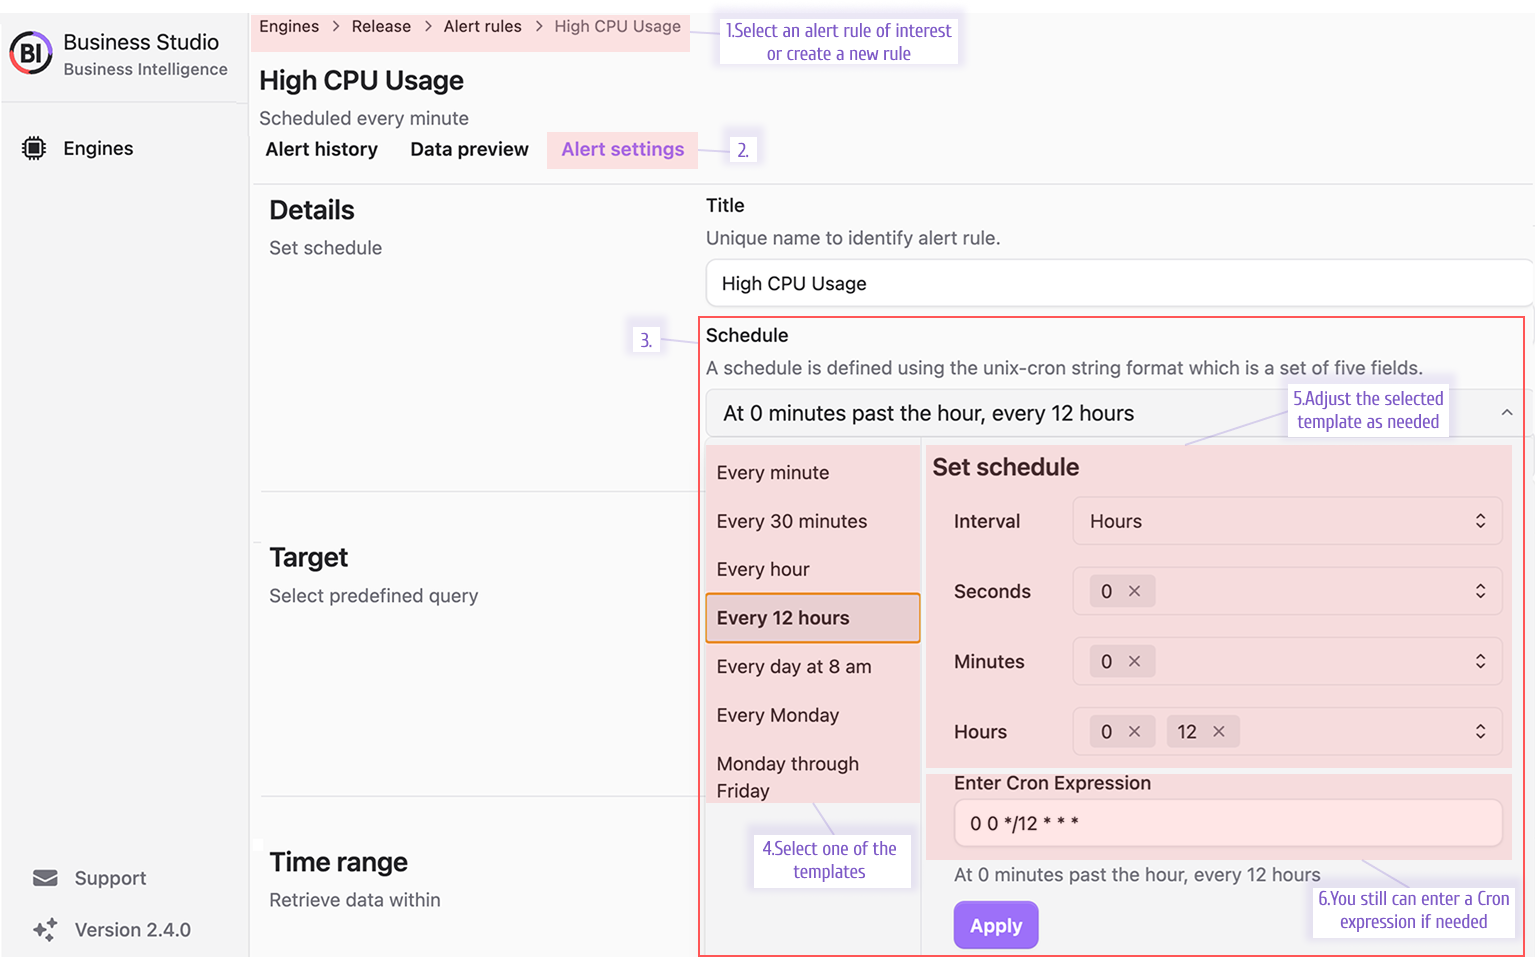
Preview Grafana Data Frames in Business Studio
Inspect the data powering your alerts without leaving Business Studio:
- Open an alert rule.
- (Optional) Verify the dashboard and panel in Alert Settings.
- Switch to Data Preview and adjust variables if necessary.
- Examine the data frame—or select View as Code for raw output.
- (Optional) Compare with Grafana’s Table View in panel edit mode.
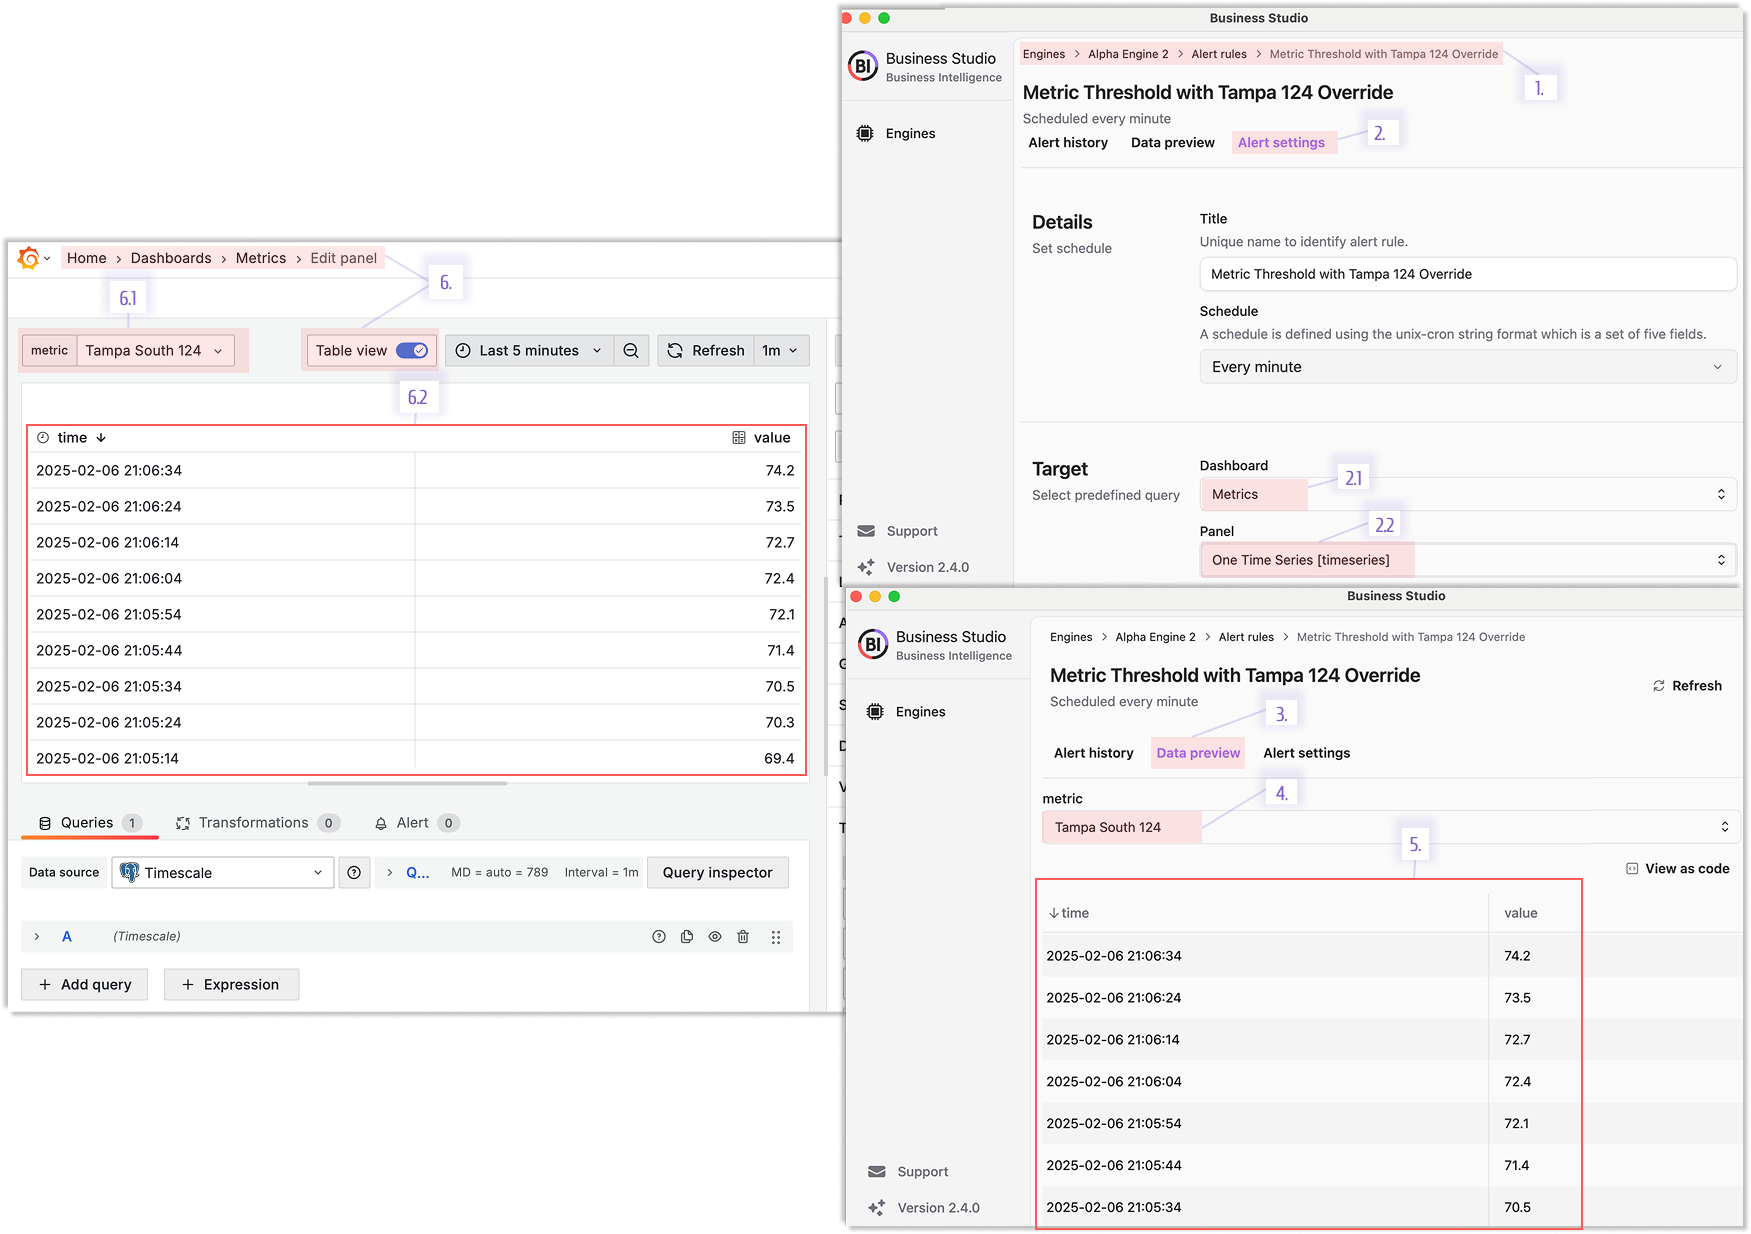
This feature bridges Business Studio and Grafana, offering full transparency into your data.
Benefit from Clearer User Prompts
We’ve enhanced UI prompts to better explain parameters, minimizing setup errors and making configuration more intuitive.
Leverage the Updated Business Engine API
The OpenAPI specification has been updated to align with 2.4.0’s new capabilities, ensuring seamless third-party integrations.
Download Business Studio 2.4.0
MacOS and Windows installers are signed, notarized, and built using automated GitHub workflows for maximum security.
- MacOS:
- Linux:
- Windows:
Getting Started
Business Intelligence Platform is a powerful solution that harnesses Docker containers to deliver a modular, scalable, and user-friendly environment for alert-driven analytics. Whether you're just starting out or are an experienced user, our Quick Start Guide is designed to help you set up and deploy the platform effortlessly.
This guide provides a step-by-step walkthrough of the essential setup process, ensuring you can get up and running in no time. Key topics include:
- Configuring the Business Engine: Understand how to set up the core component that powers your analytics.
- Launching the Business Studio: Deploy and access the intuitive interface on your local machine for seamless management and visualization.
We’d Love to Hear From You!
Your feedback and ideas are invaluable to us! Here’s how you can get involved:
- Questions, Feature Requests, or Bugs: Submit a Zendesk ticket to receive a swift and personalized response from our dedicated support team.
- Join the Community: Subscribe to our YouTube Channel and share your thoughts or suggestions in the comments.
Your input is crucial in helping us grow and improve, so please don’t hesitate to reach out!


