Business Intelligence 3.3.1: Transform Your Grafana Workflows with Alert-Driven Analytics
We’re thrilled to announce Business Intelligence 3.3.1, a major update to the Business Intelligence platform. This release introduces powerful features to streamline workflows, uncover deeper insights, and enhance your Grafana experience. Let’s dive into what’s new!
What’s New in Business Intelligence 3.3.1
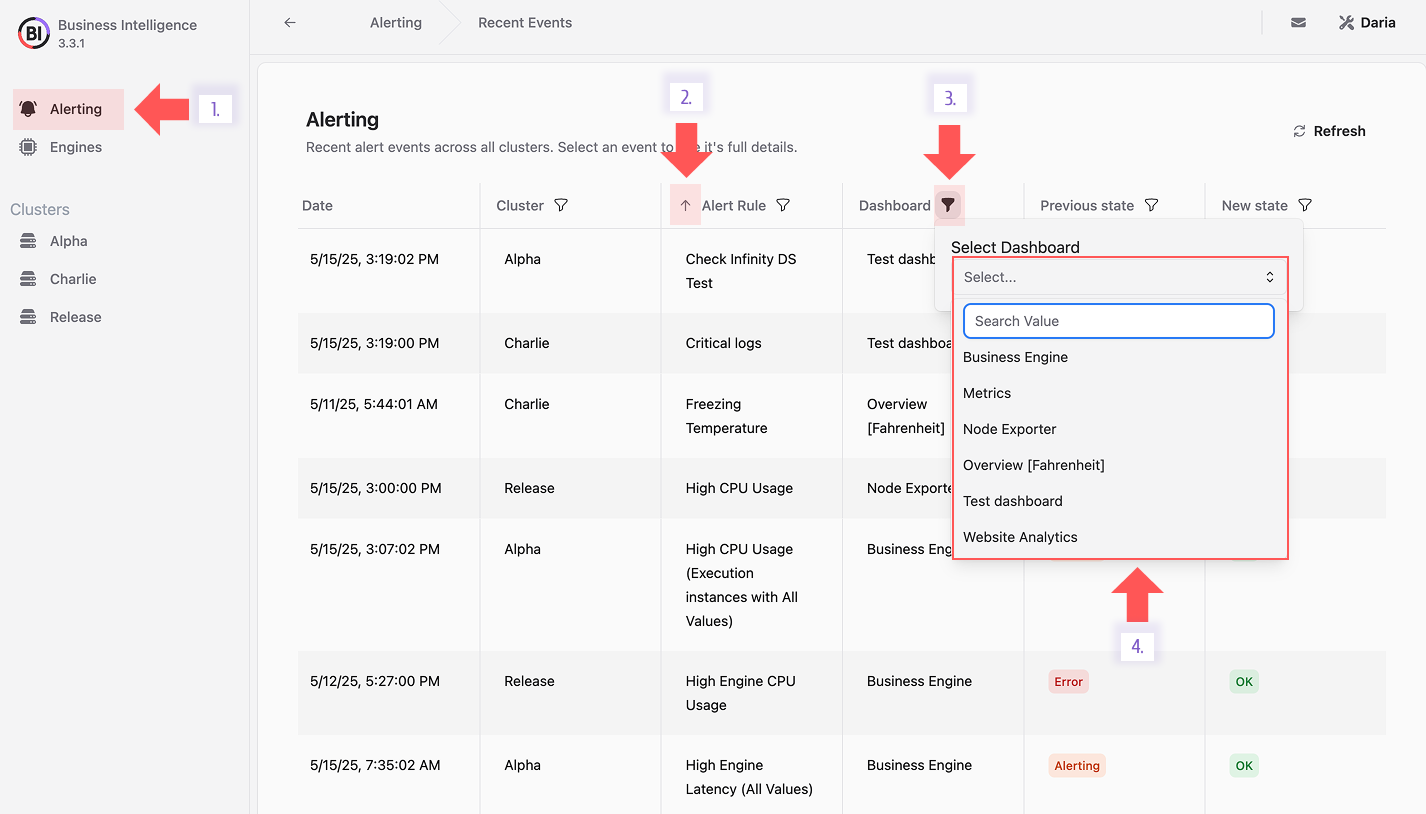
- Revamped Alerting Page: Navigate and manage alerts effortlessly with an intuitive UI and advanced filtering options.
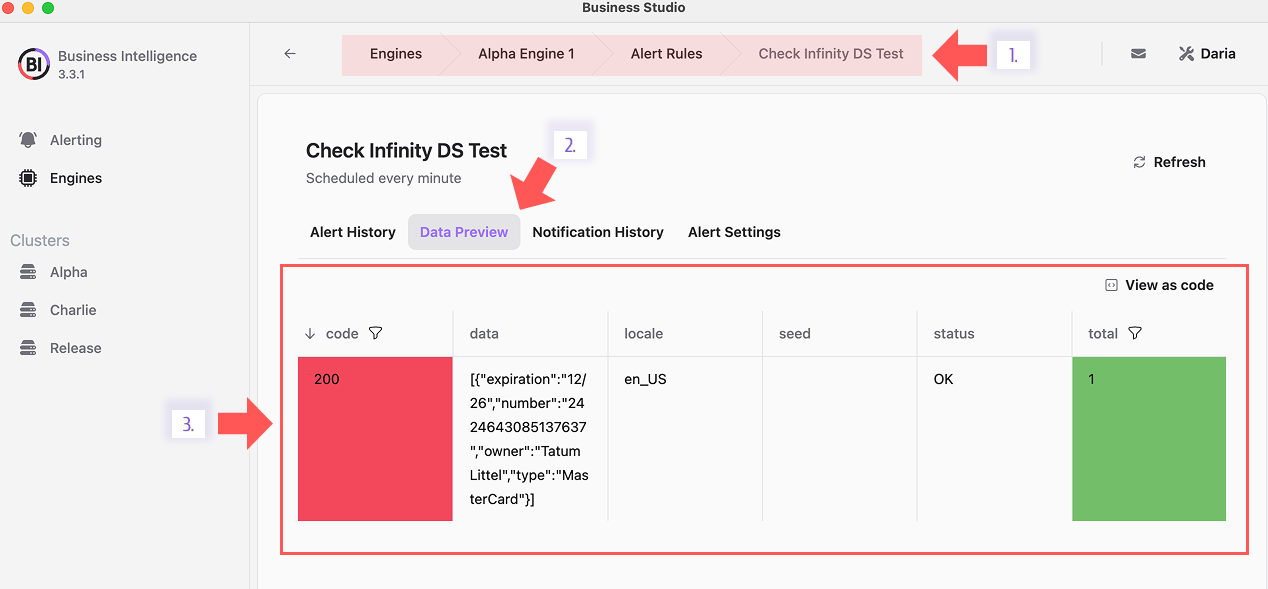
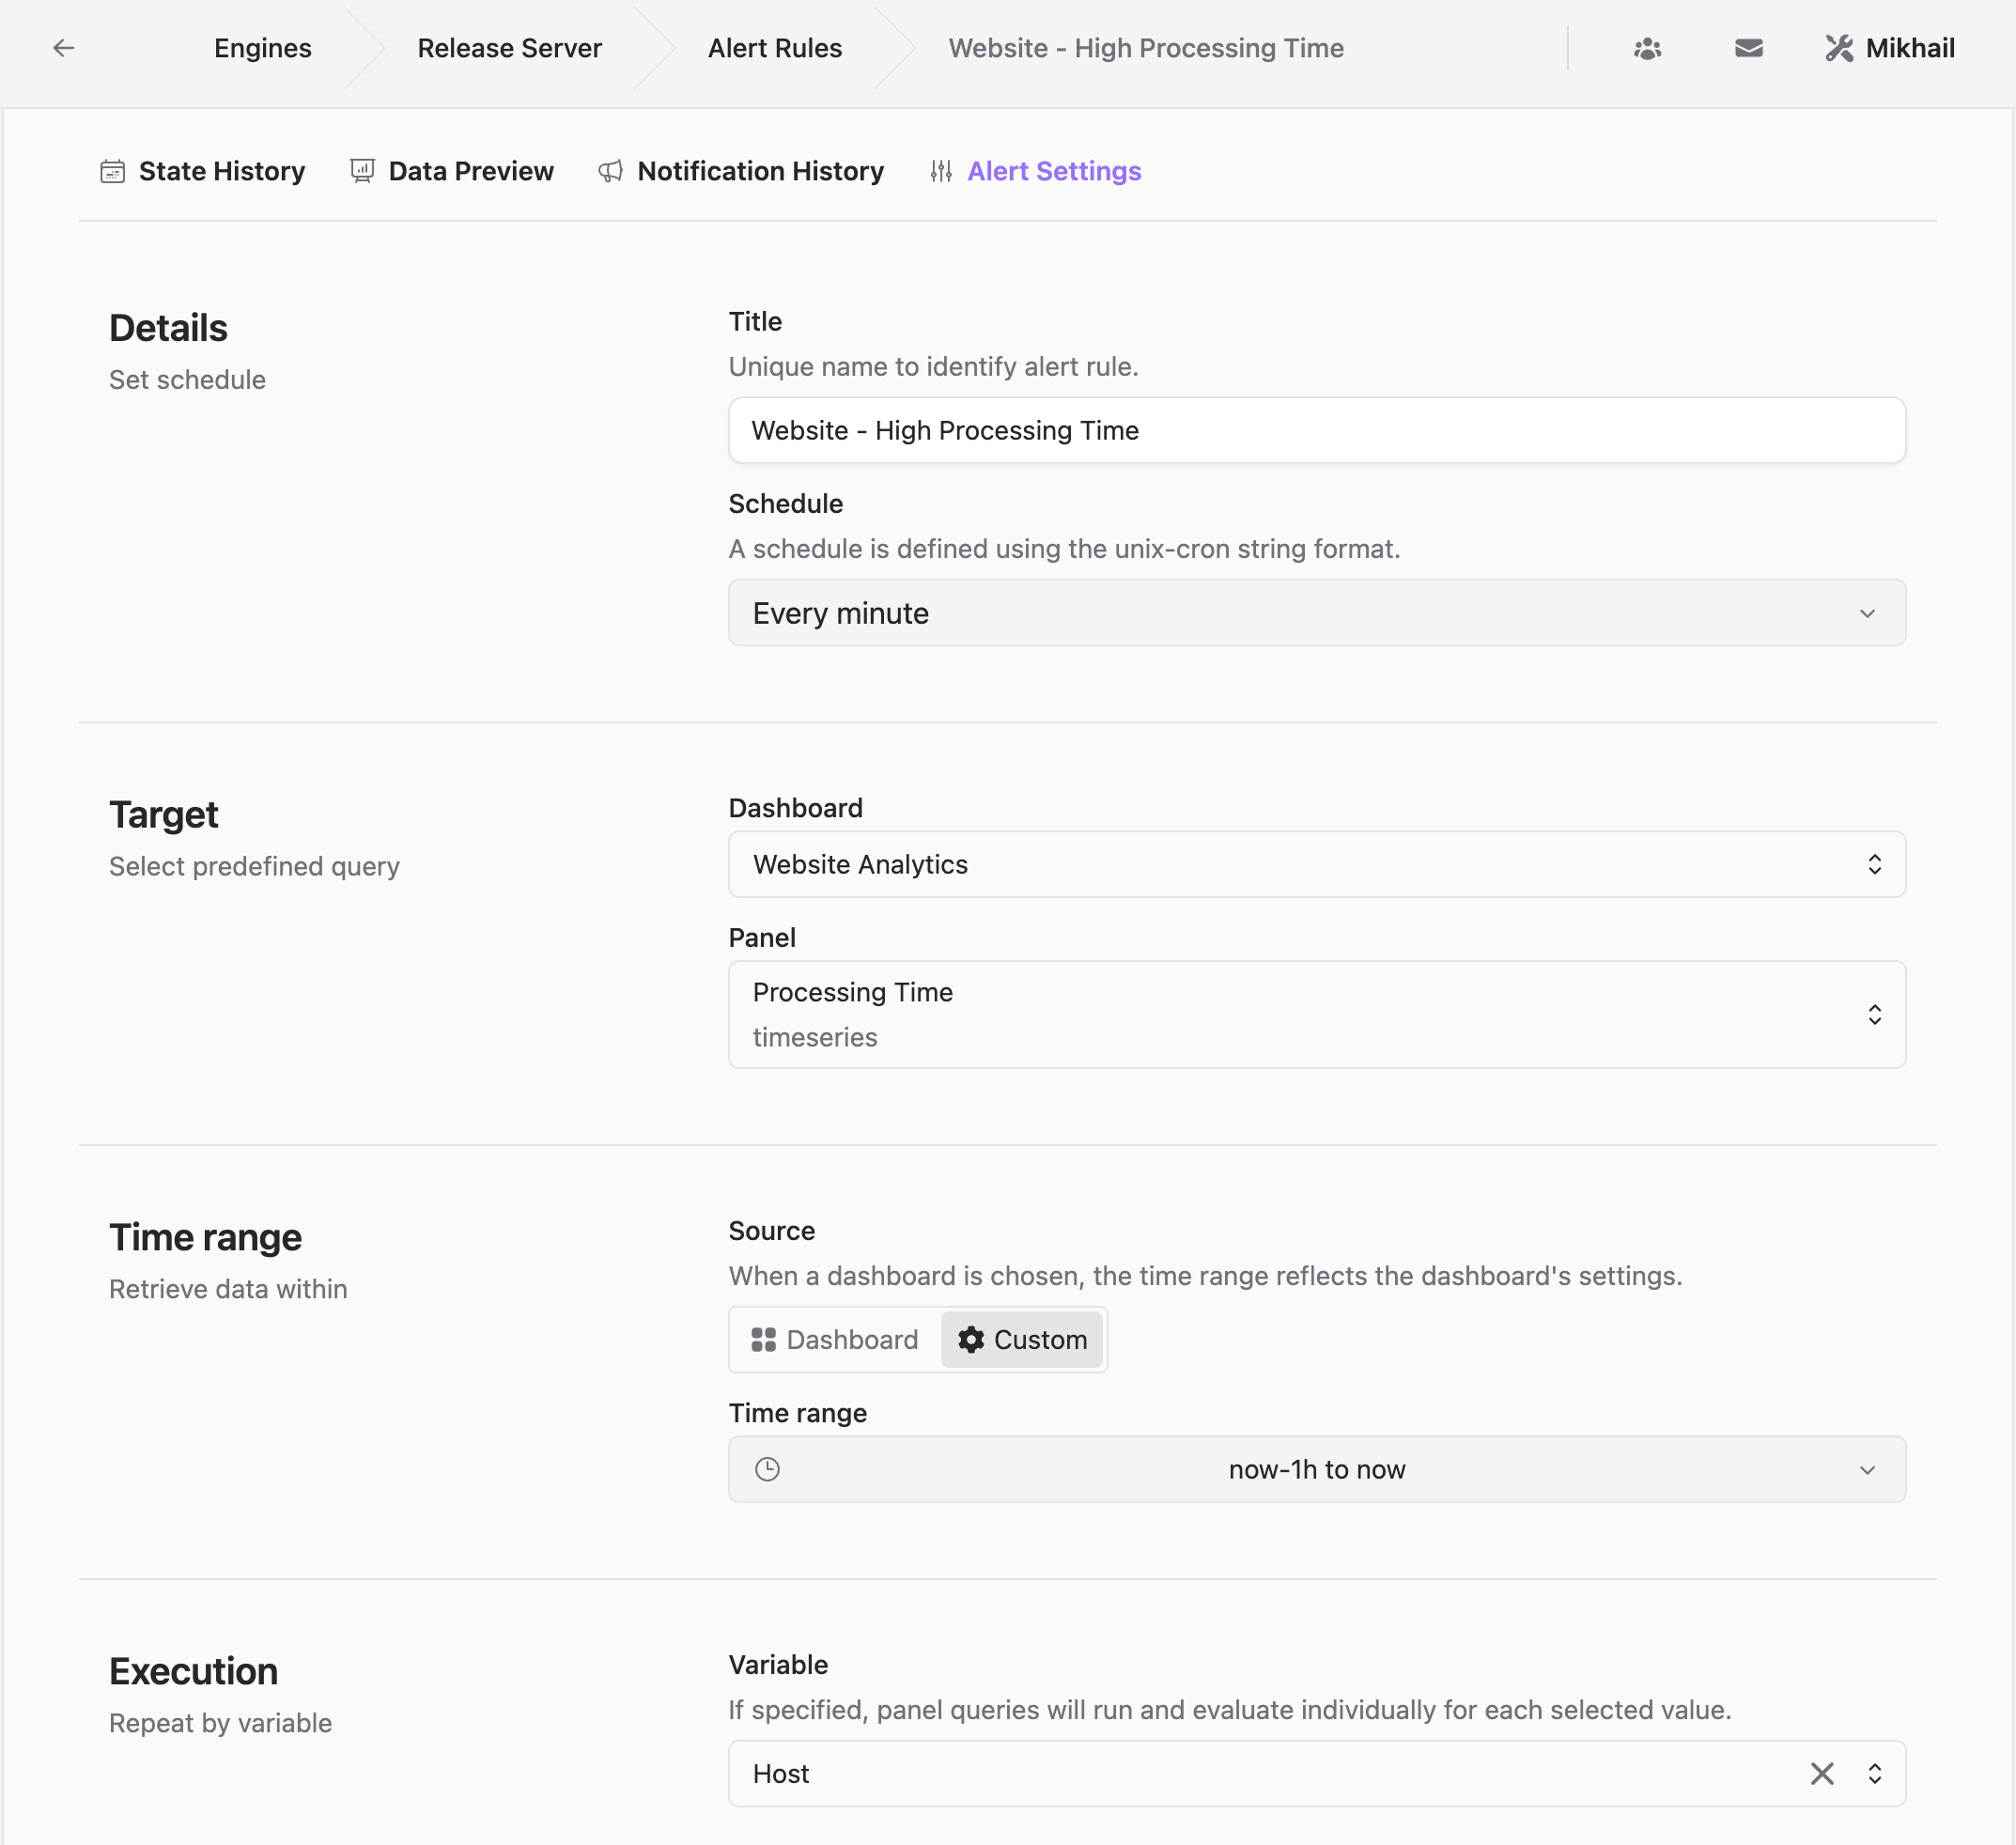
- Data Preview Feature: Preview data directly on the Alert Settings page to ensure accuracy before activation.
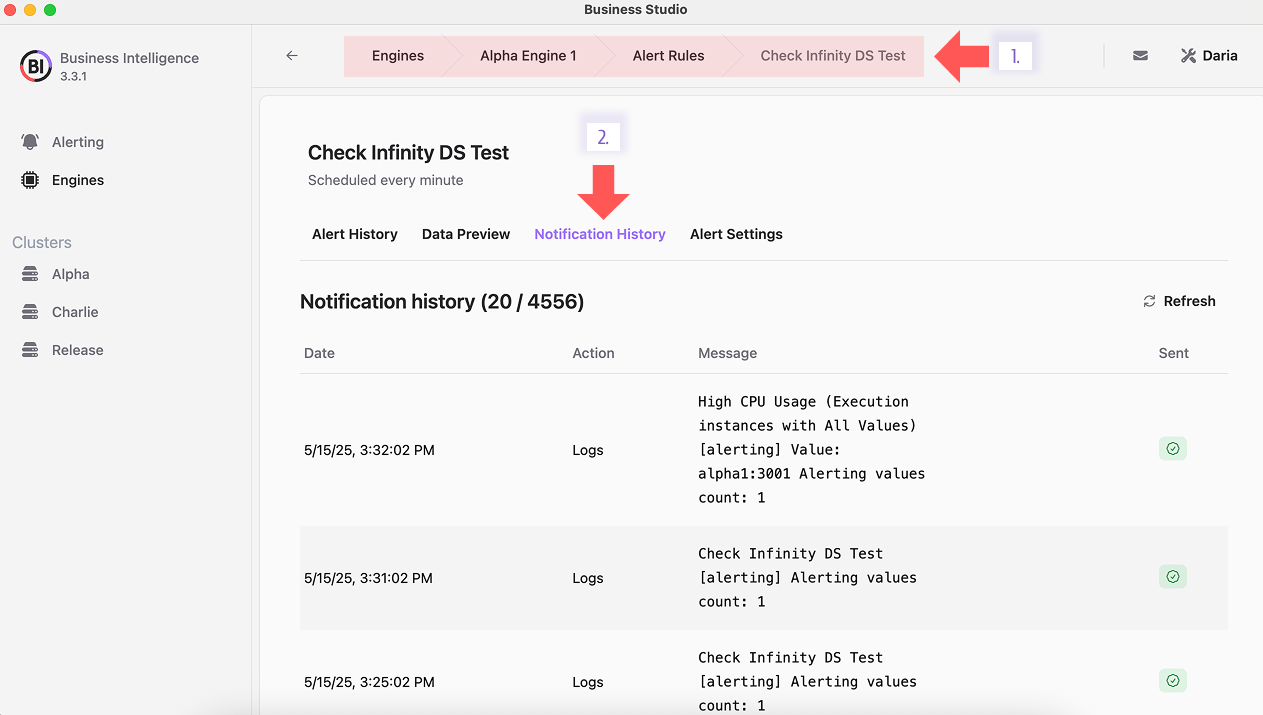
- Alert Notification History: Access a detailed log of past notifications for transparency and accountability.
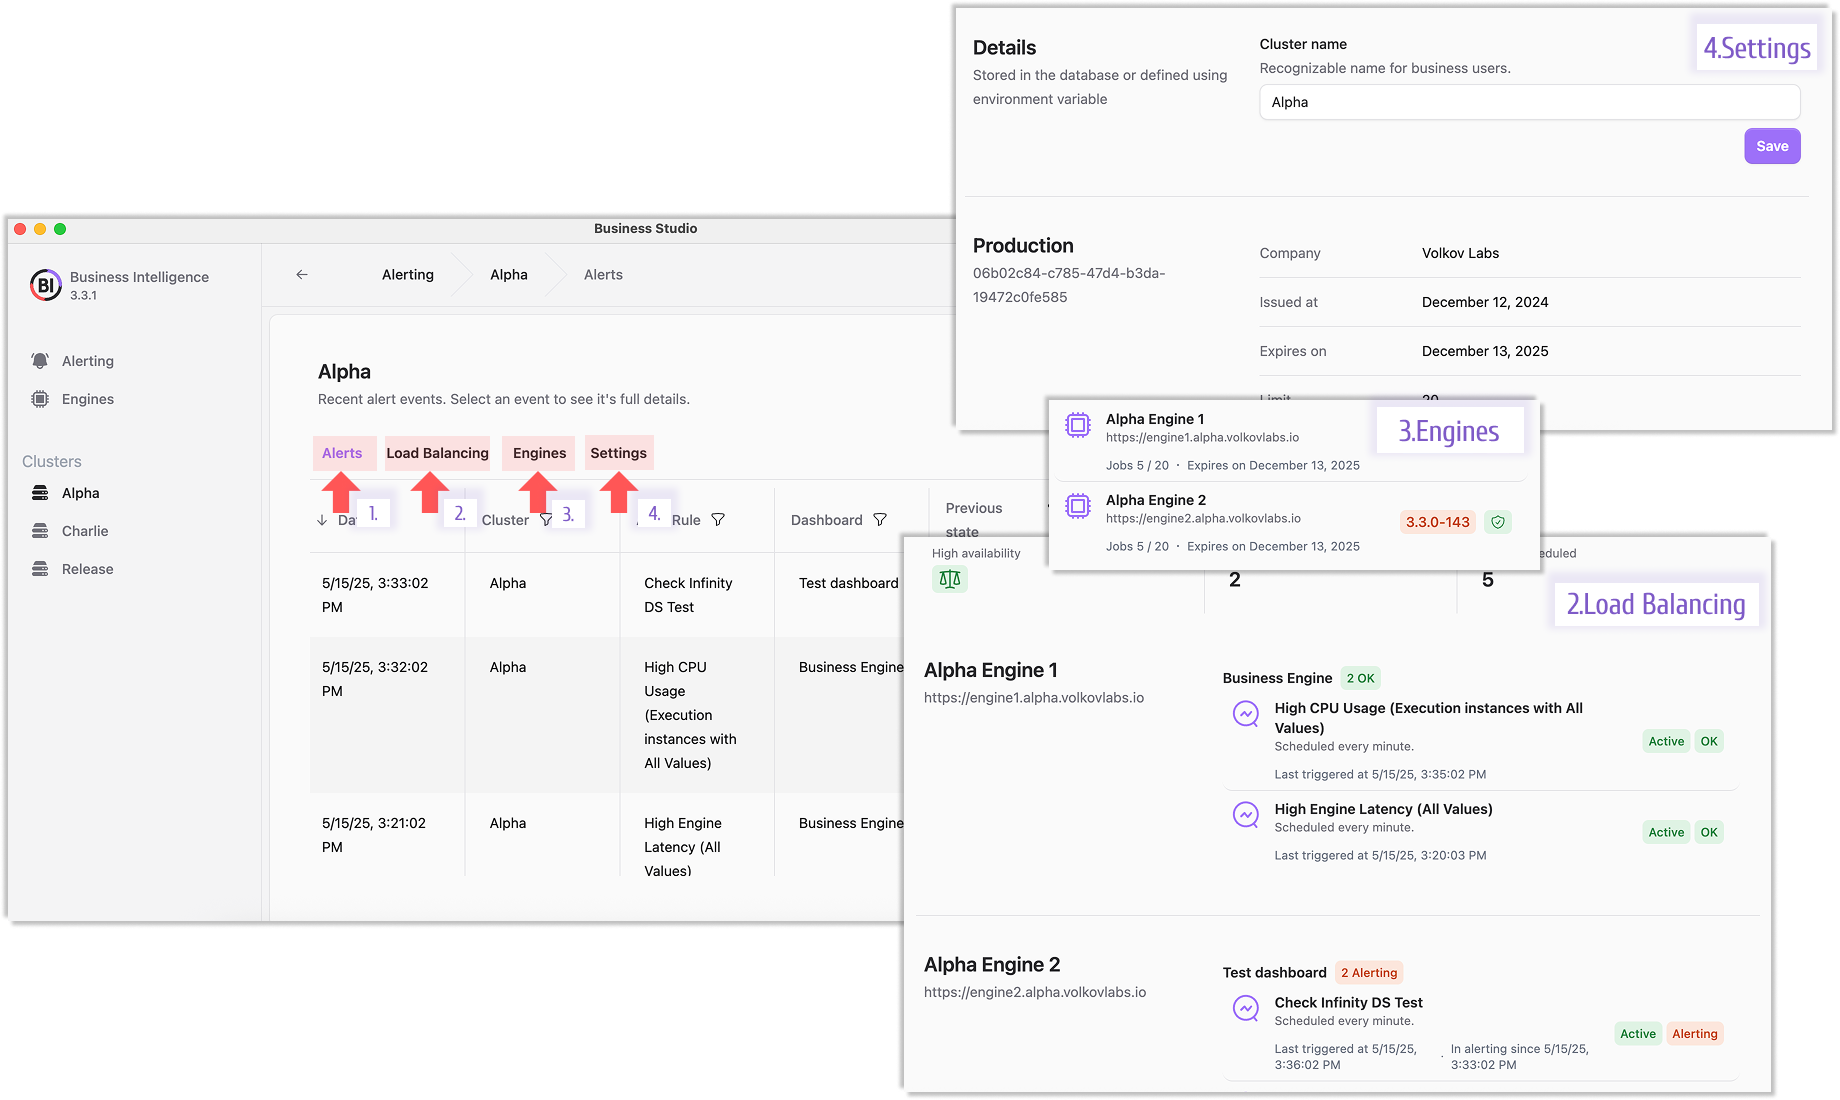
- Enhanced Clustering: Updated clustering pages now support alerting and engine configurations for better scalability.
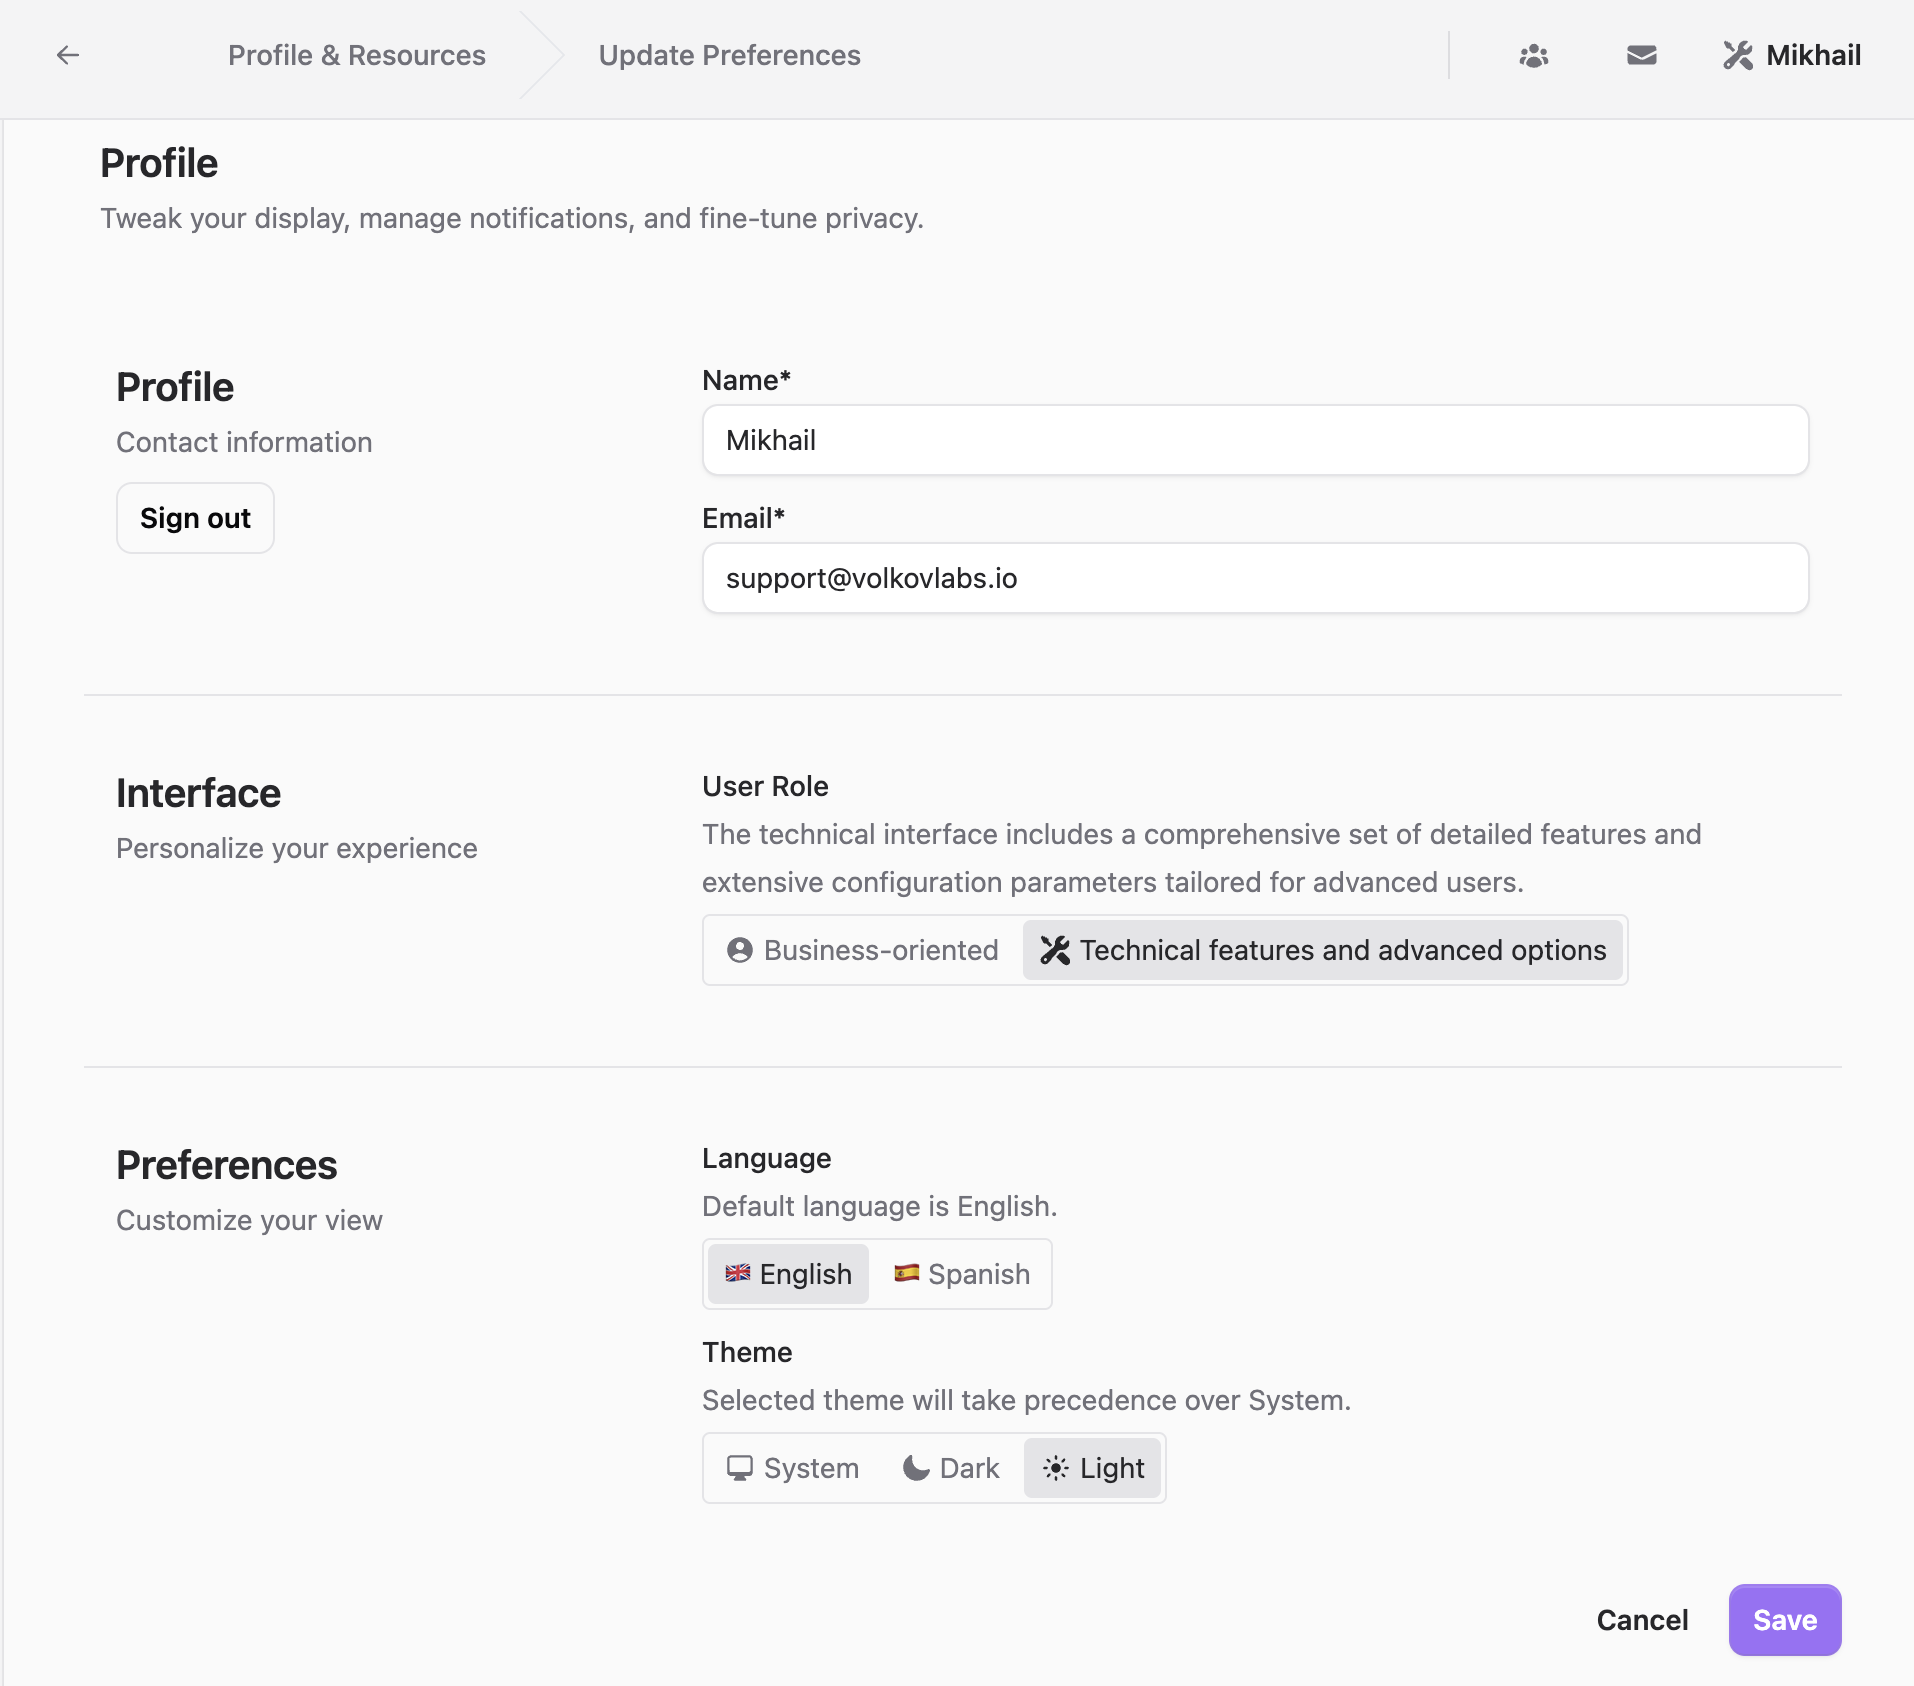
- Localization Support: Spanish language added to improve accessibility for global users.
- Personalization Options: Customize themes via profile settings for a tailored user experience.
- New Data Source: Loki integration enhances logging and debugging within Grafana.
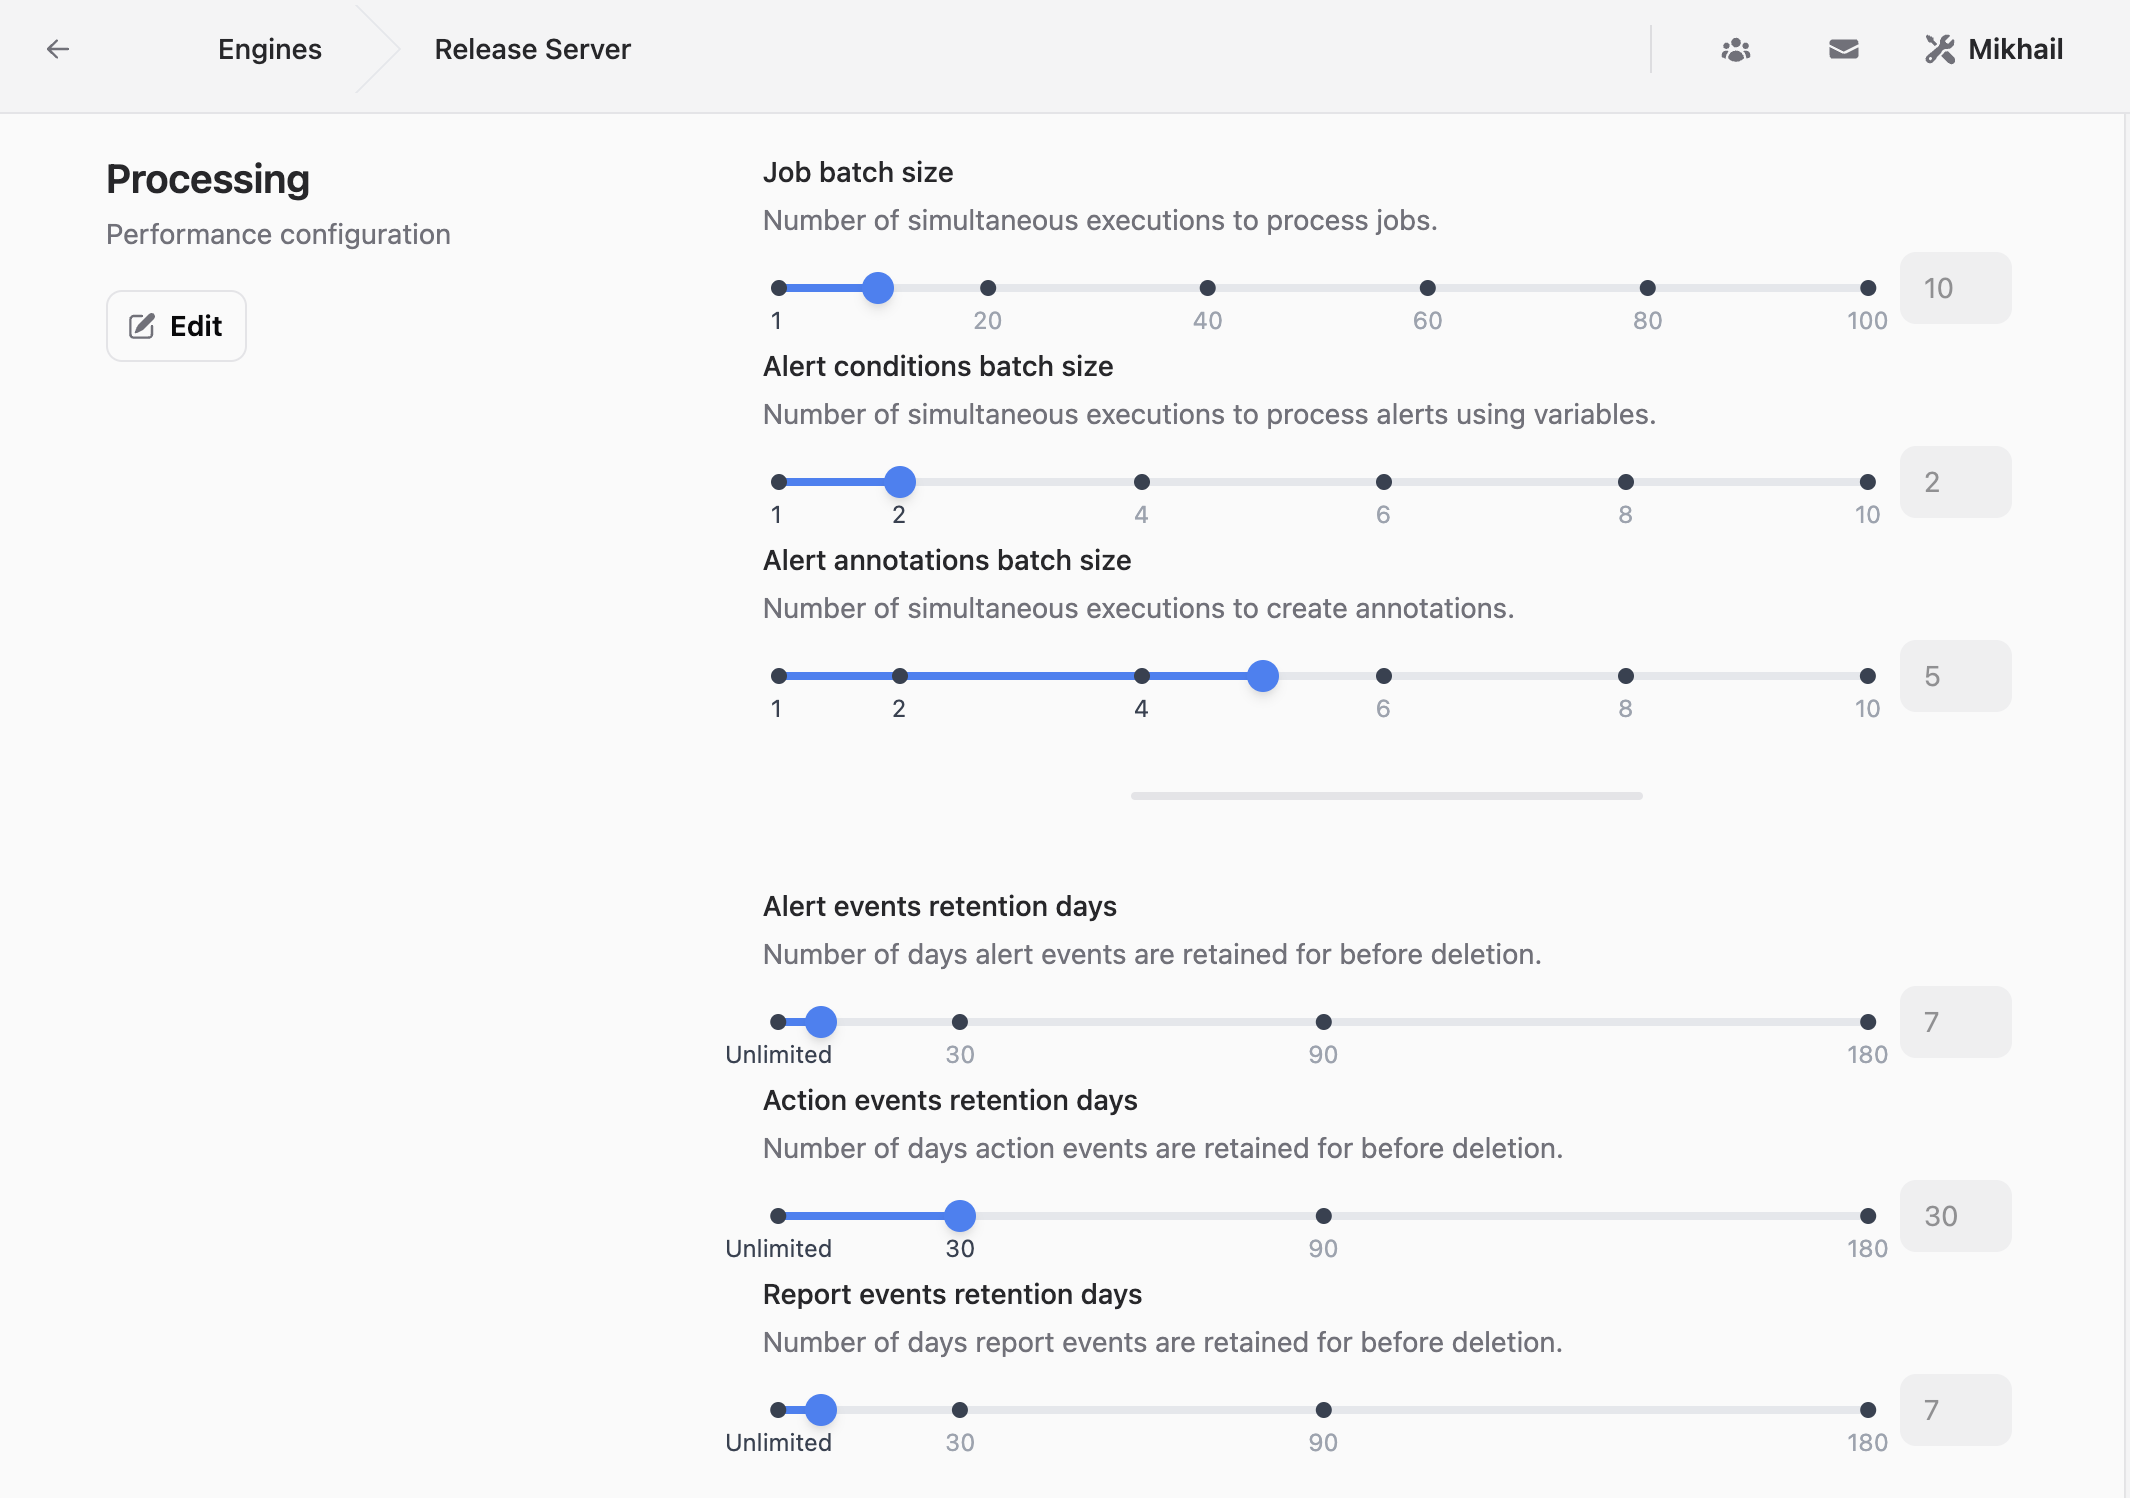
- Faster Alert Processing: Optimize performance with customizable batch sizes for alerts and annotations in Engine settings.
Join Mikhail for an in-depth look at these exciting updates:
Ready to transform your Grafana workflows? Explore Business Intelligence 3.3.1 today!
Revamped Alerting Page
Based on user feedback about navigation challenges, we’ve redesigned the alerting page with a user-friendly interface. The new layout simplifies finding and managing alerts, while advanced filtering options allow sorting by specific criteria. This saves time and boosts efficiency, especially for teams monitoring large-scale systems in Grafana.
Data Preview Feature
Setting up alerts is now simpler than ever. The Data Preview feature, integrated into the Alert Settings page, lets you view a snapshot of relevant data without switching tabs or running separate queries. This reduces setup errors and builds confidence in your monitoring system by ensuring alerts are based on accurate data.
Alert Notification History
Transparency is crucial in critical environments. The Alert Notification History feature offers a comprehensive log of past notifications, including trigger times and conditions. This is invaluable for auditing, troubleshooting false positives, and meeting compliance requirements in high-stakes operations.
Enhanced Clustering
For distributed environments, clustering is essential for scaling Business Intelligence deployments. The updated clustering pages now display the latest alerts and engine lists, providing greater visibility and control over your infrastructure.
Localization Support
To reach a global audience, Business Intelligence 3.3.1 introduces Spanish language support. This update breaks down language barriers, making the platform more accessible and user-friendly for Spanish-speaking teams and organizations.

Personalization Options
Elevate your user experience with customizable themes in profile settings. Whether you prefer light or dark mode, tailoring the platform’s appearance ensures comfort during extended monitoring sessions and creates a more engaging interaction with Grafana dashboards.
New Data Source
The addition of Loki as a data source significantly boosts logging capabilities. Designed for scalability, Loki enables seamless log aggregation alongside metrics and visualizations in Grafana. This unified view is critical for debugging, event correlation, and gaining deeper insights into application performance.
Faster Alert Processing
Performance is paramount in high-volume monitoring scenarios. Customizable batch sizes for alerts and annotations in Engine settings allow administrators to fine-tune throughput and resource usage. This ensures faster alert delivery without overloading the system, ideal for organizations with large datasets or frequent triggers.
Enhanced OpenAPI Specification
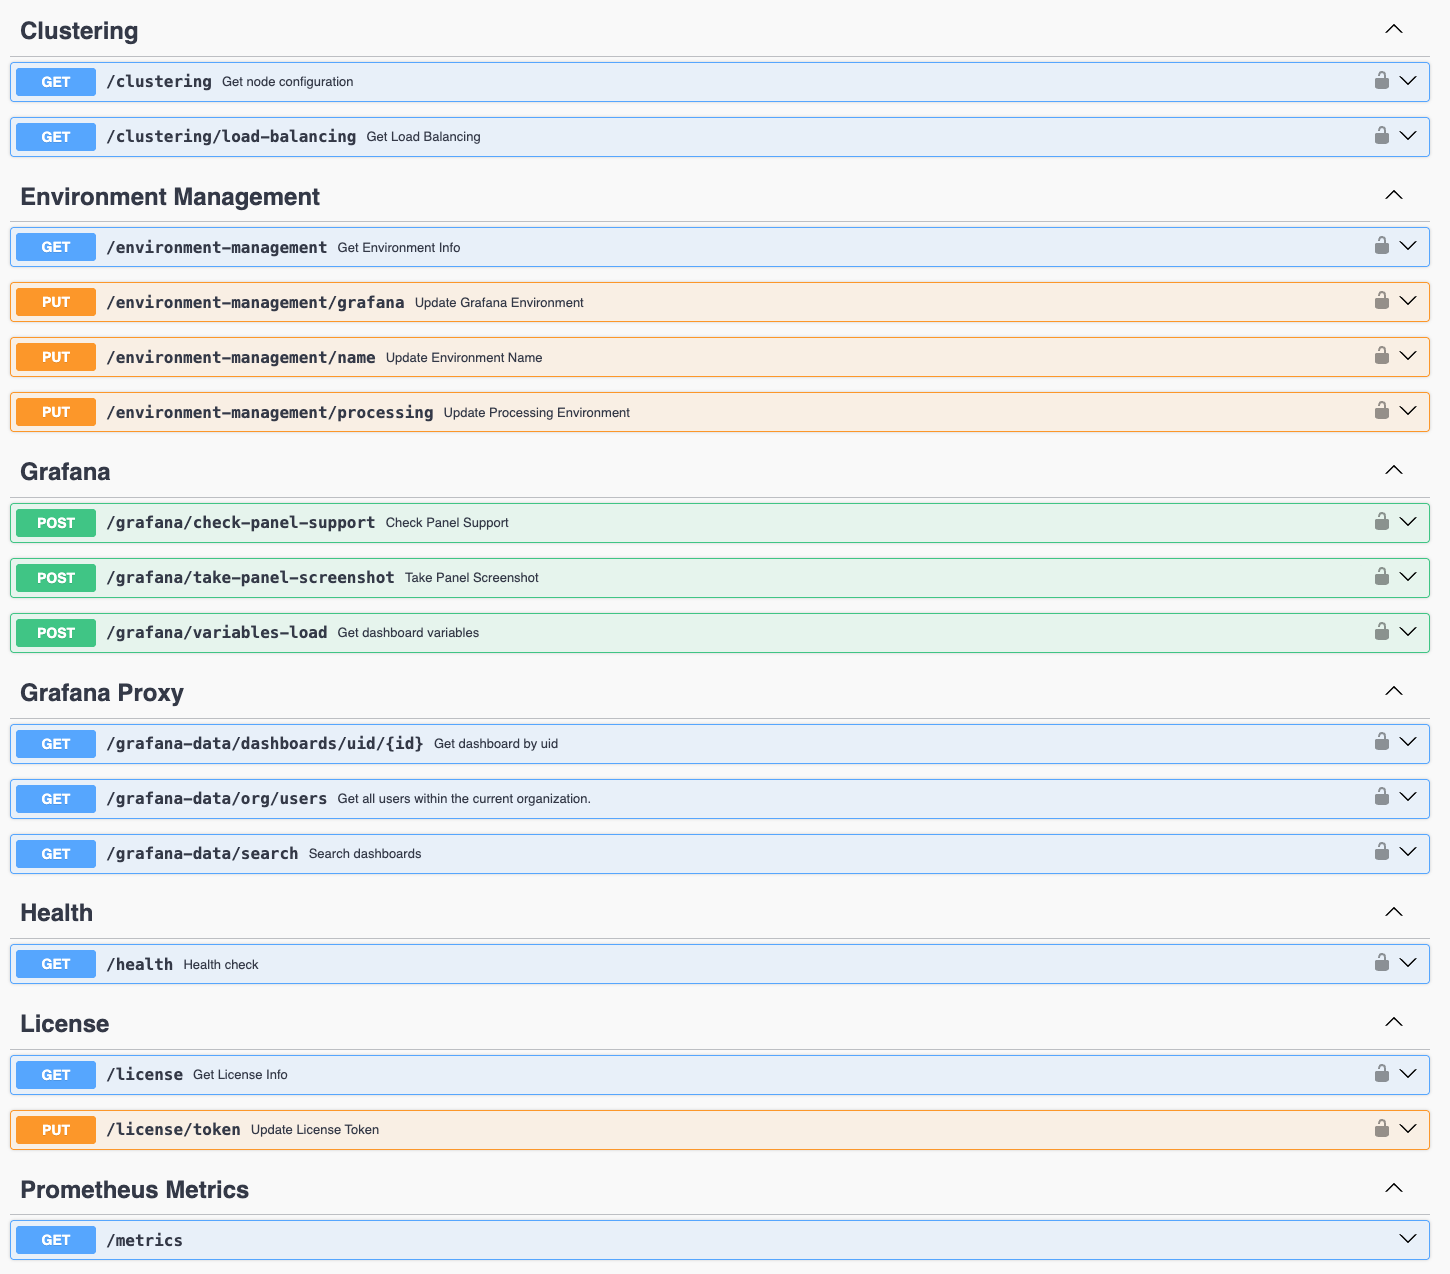
The Business Engine’s OpenAPI specification has been fully updated, enabling seamless integrations and empowering developers to leverage the platform’s latest capabilities with ease.
Download Business Studio 3.3.1
MacOS and Windows installers are signed, notarized, and built using automated GitHub workflows for maximum security and reliability.
- MacOS:
- Windows:
- Linux:
Getting Started
Business Intelligence Platform is a powerful solution that harnesses Docker containers to deliver a modular, scalable, and user-friendly environment for alert-driven analytics. Whether you're just starting out or are an experienced user, our Quick Start Guide is designed to help you set up and deploy the platform effortlessly.
This guide provides a step-by-step walkthrough of the essential setup process, ensuring you can get up and running in no time. Key topics include:
- Configuring the Business Engine: Understand how to set up the core component that powers your analytics.
- Launching the Business Studio: Deploy and access the intuitive interface on your local machine for seamless management and visualization.
We’d Love to Hear From You!
Your feedback and ideas are invaluable to us! Here’s how you can get involved:
- Questions, Feature Requests, or Bugs: Submit a Zendesk ticket to receive a swift and personalized response from our dedicated support team.
- Join the Community: Subscribe to our YouTube Channel and share your thoughts or suggestions in the comments.
Your input is crucial in helping us grow and improve, so please don’t hesitate to reach out!


